How to use
Take it easy
The Mists of Time
Many years ago, a newly married unemployed developer called Shay Banon followed his wife to London, where she was studying to be a chef. While looking for gainful employment, he started playing with an early version of Lucene, with the intent of building his wife a recipe search engine.
Working directly with Lucene can be tricky, so Shay started work on an abstraction layer to make it easier for Java programmers to add search to their applications. He released this as his first open source project, called Compass.
Later Shay took a job working in a high-performance, distributed environment with in-memory data grids. The need for a high-performance, real-time, distributed search engine was obvious, and he decided to rewrite the Compass libraries as a standalone server called Elasticsearch.
The first public release came out in February 2010. Since then, Elasticsearch has become one of the most popular projects on GitHub with commits from over 300 contributors. A company has formed around Elasticsearch to provide commercial support and to develop new features, but Elasticsearch is, and forever will be, open source and available to all.
Shay’s wife is still waiting for the recipe search…
- elastic/elasticsearch-definitive-guide: The Definitive Guide to Elasticsearch
- ElasticSearch Cookbook, Second Edition: Alberto Paro: 9781783554836: Amazon.com: Books
use cases
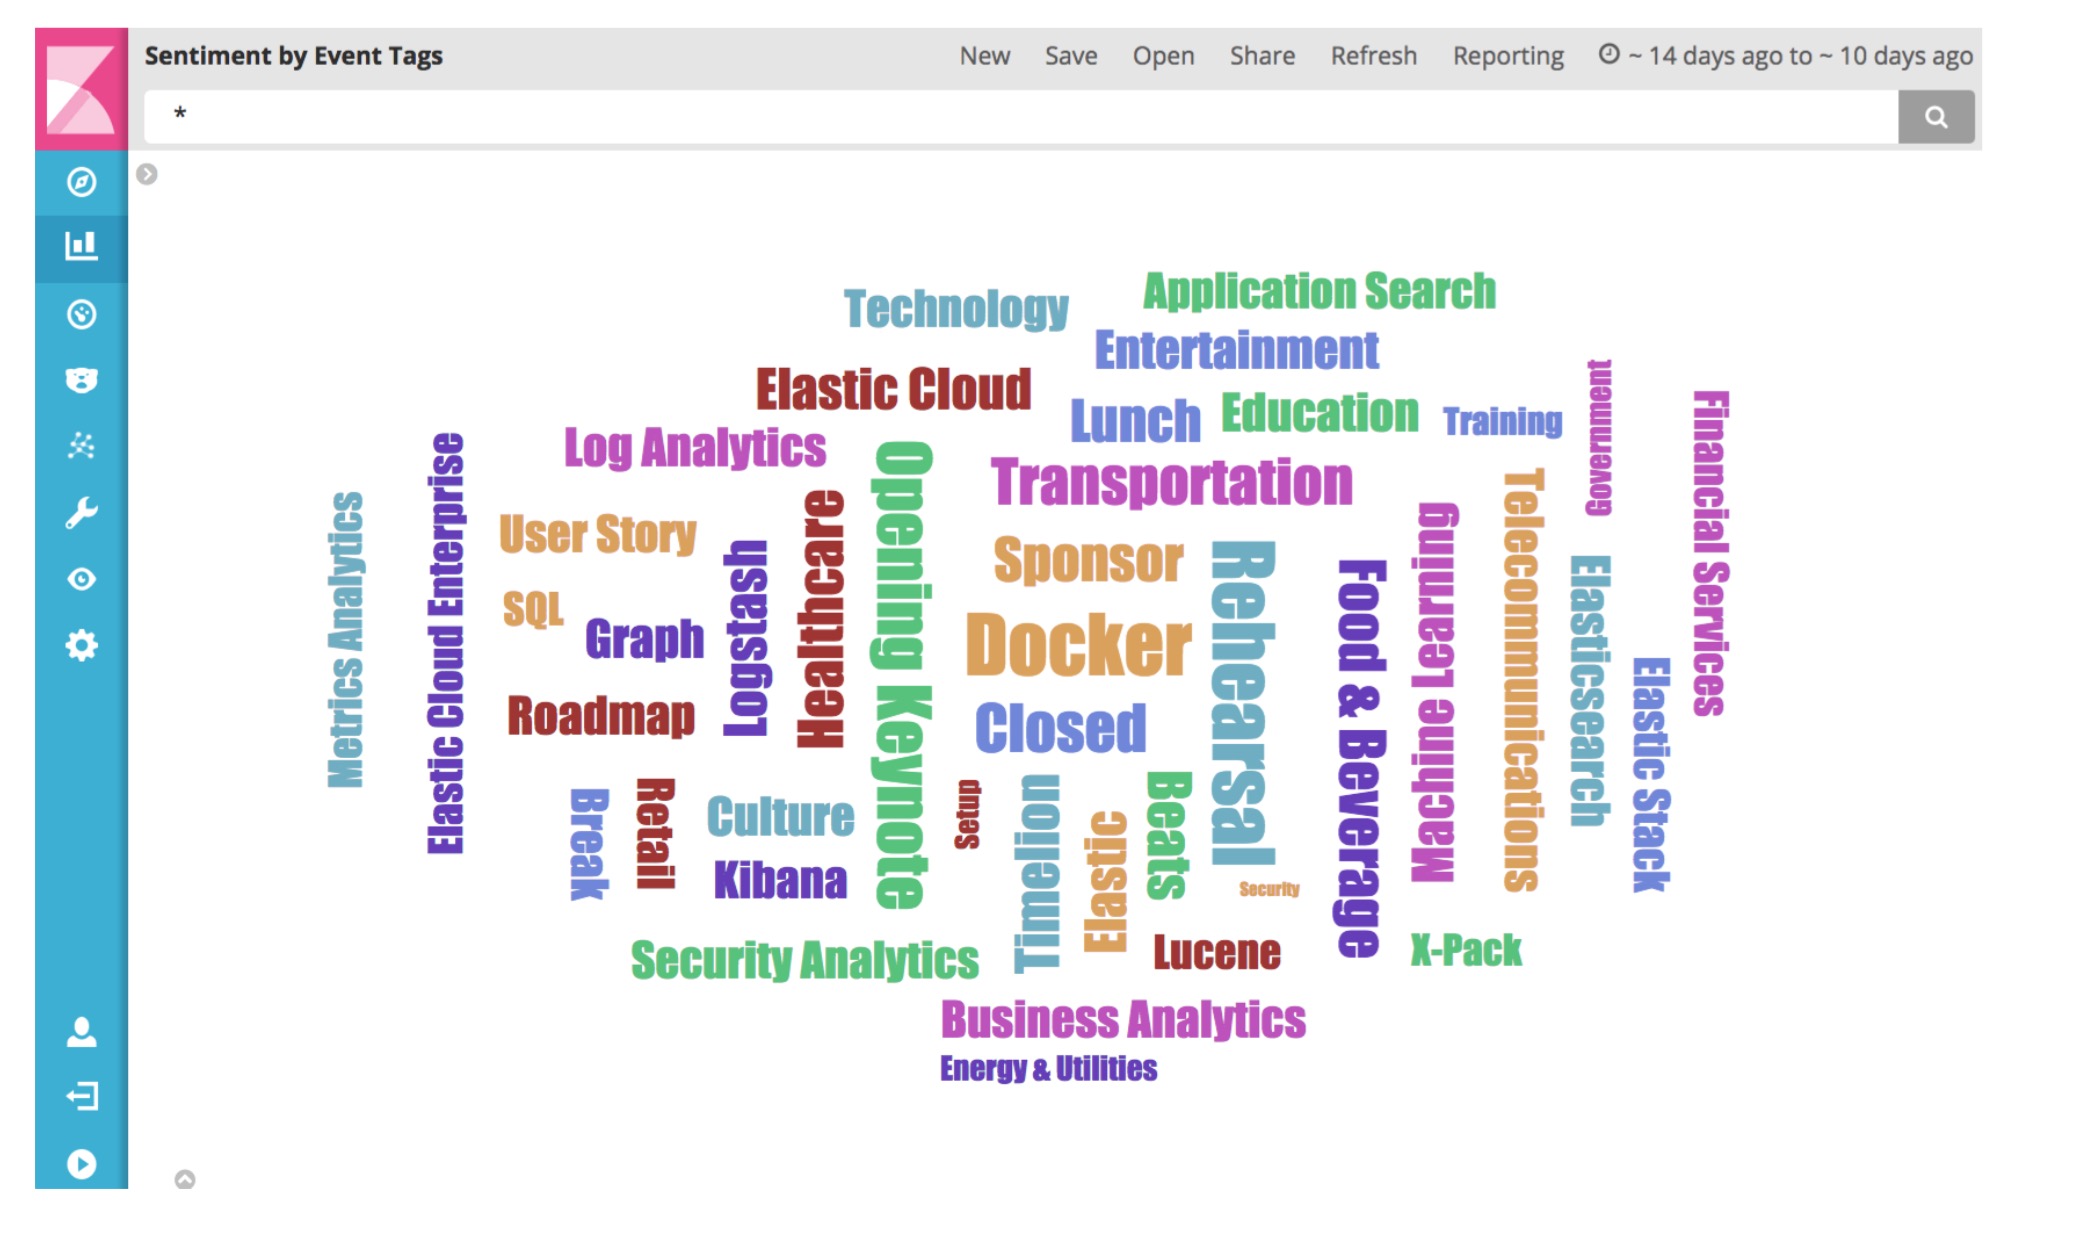
- Tag Cloud
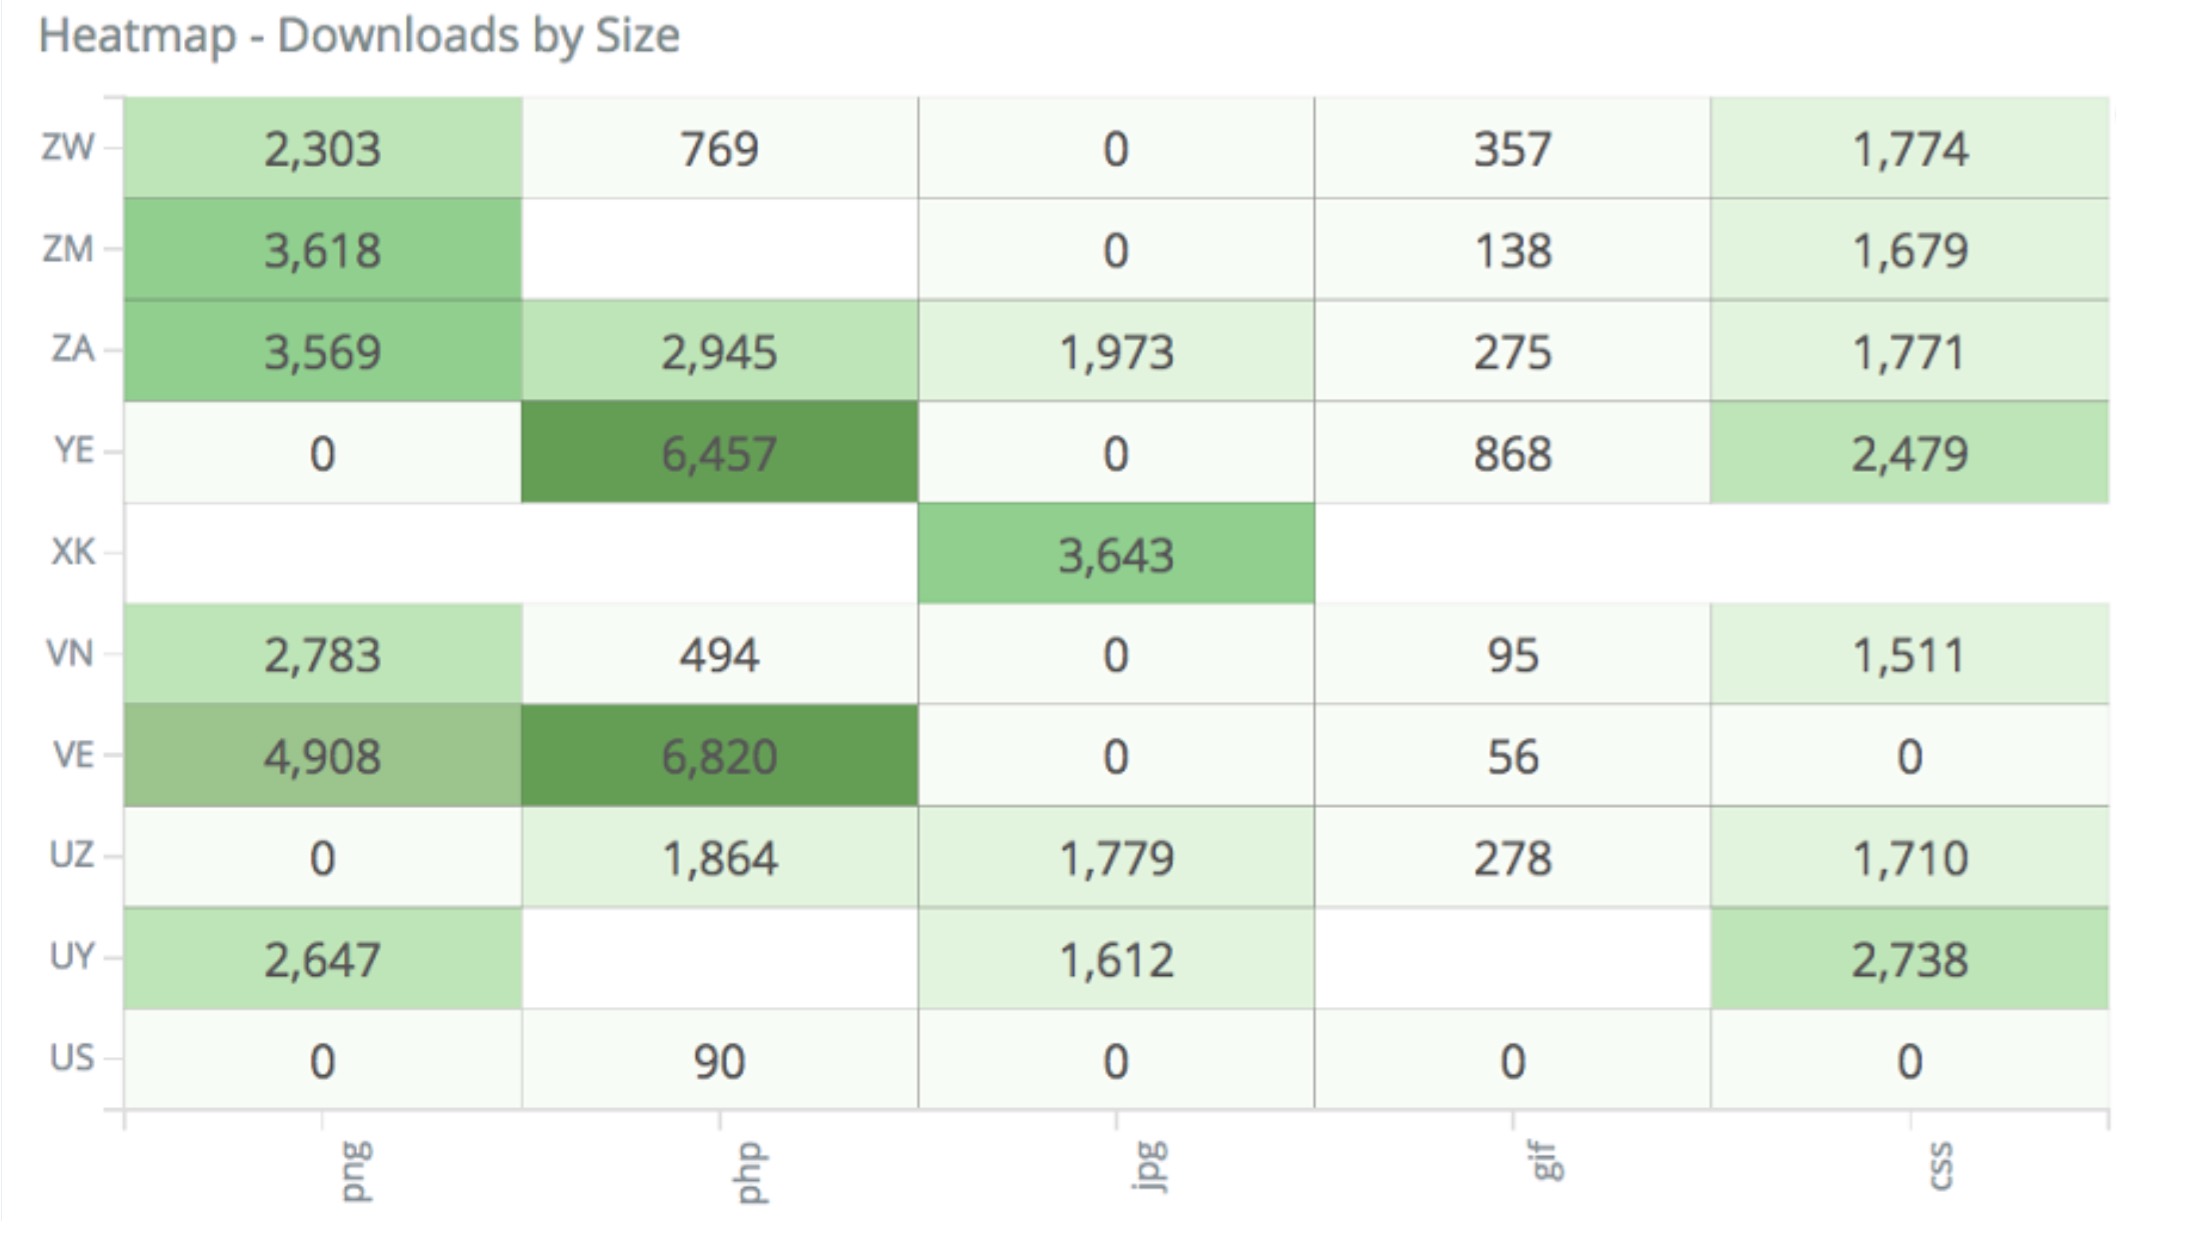
- Heatmaps
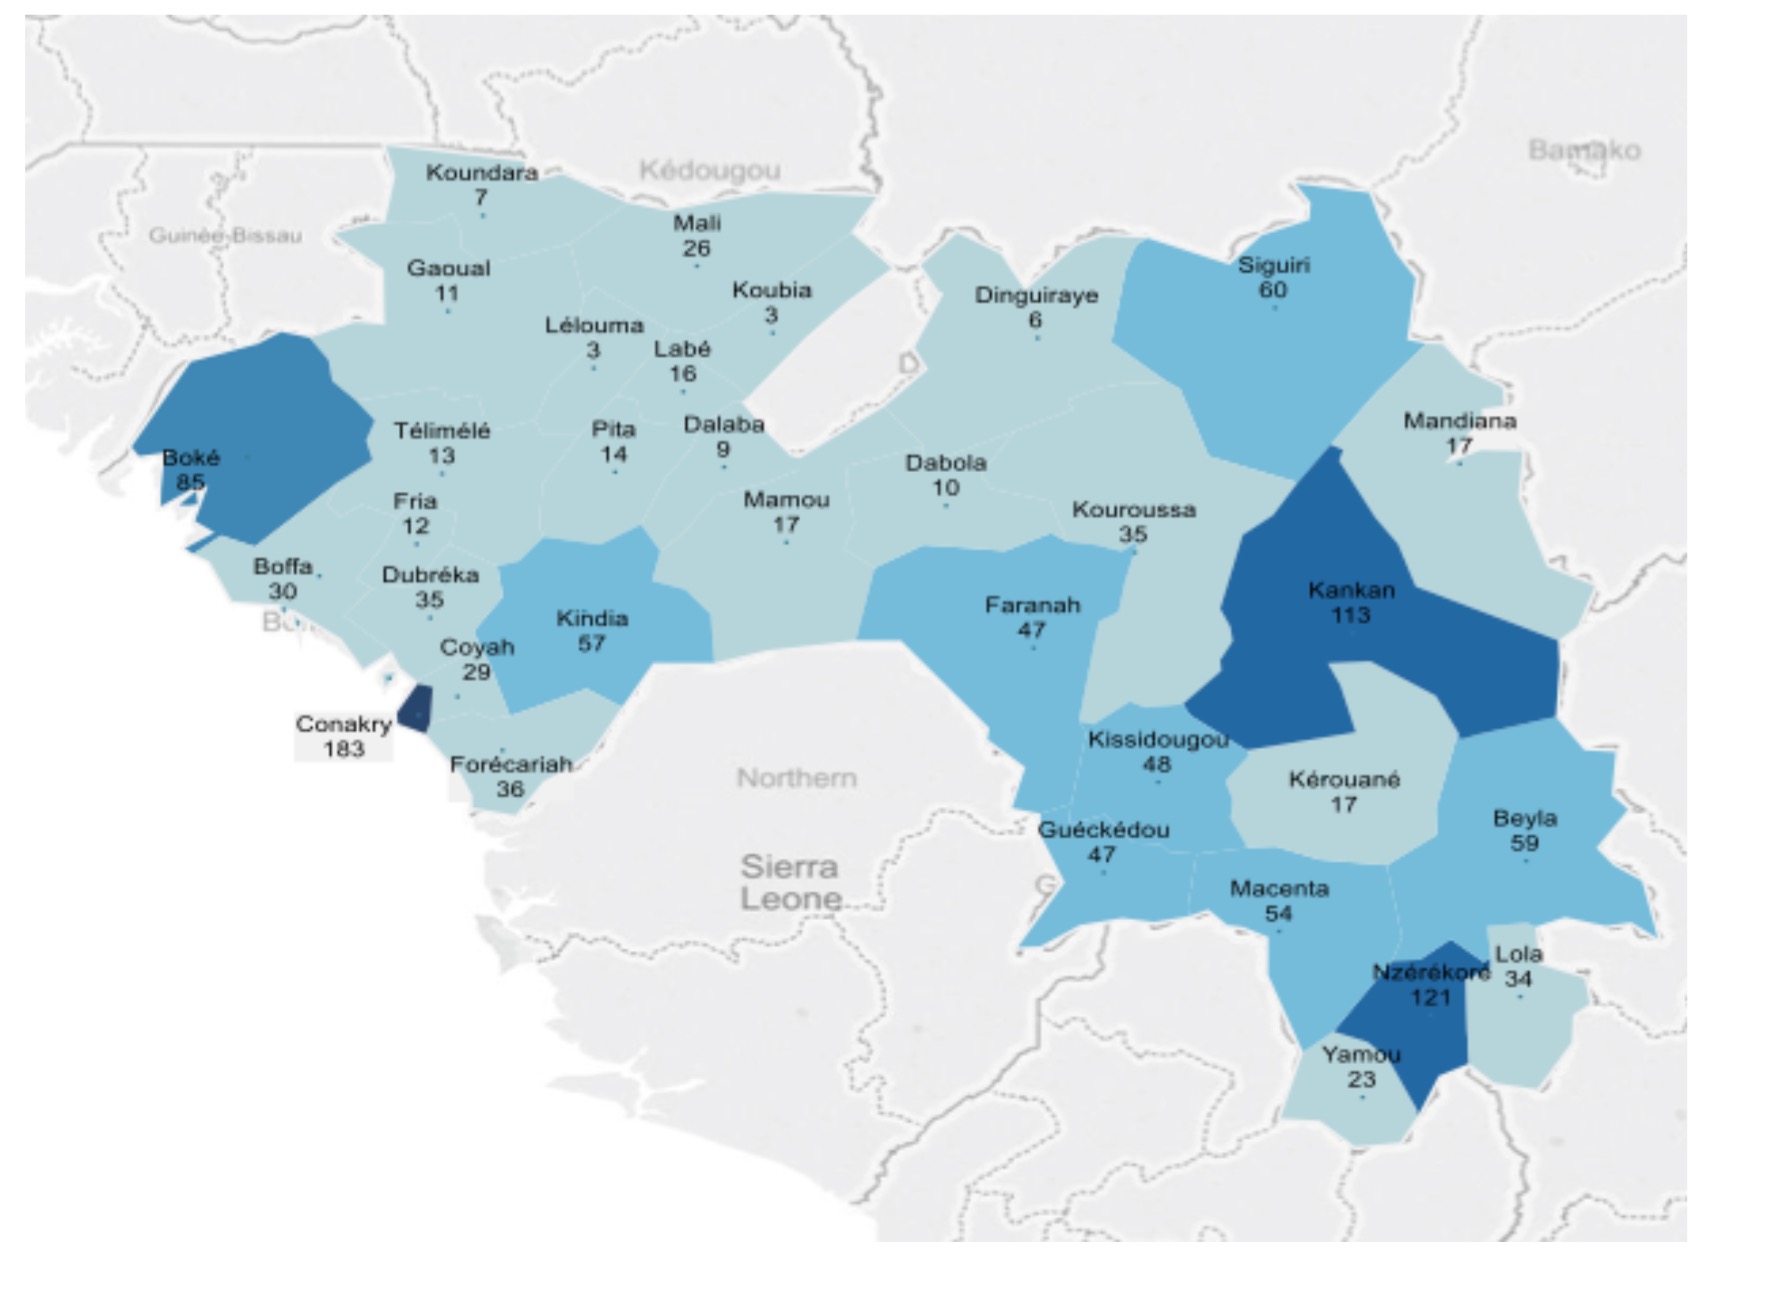
- Vector Maps
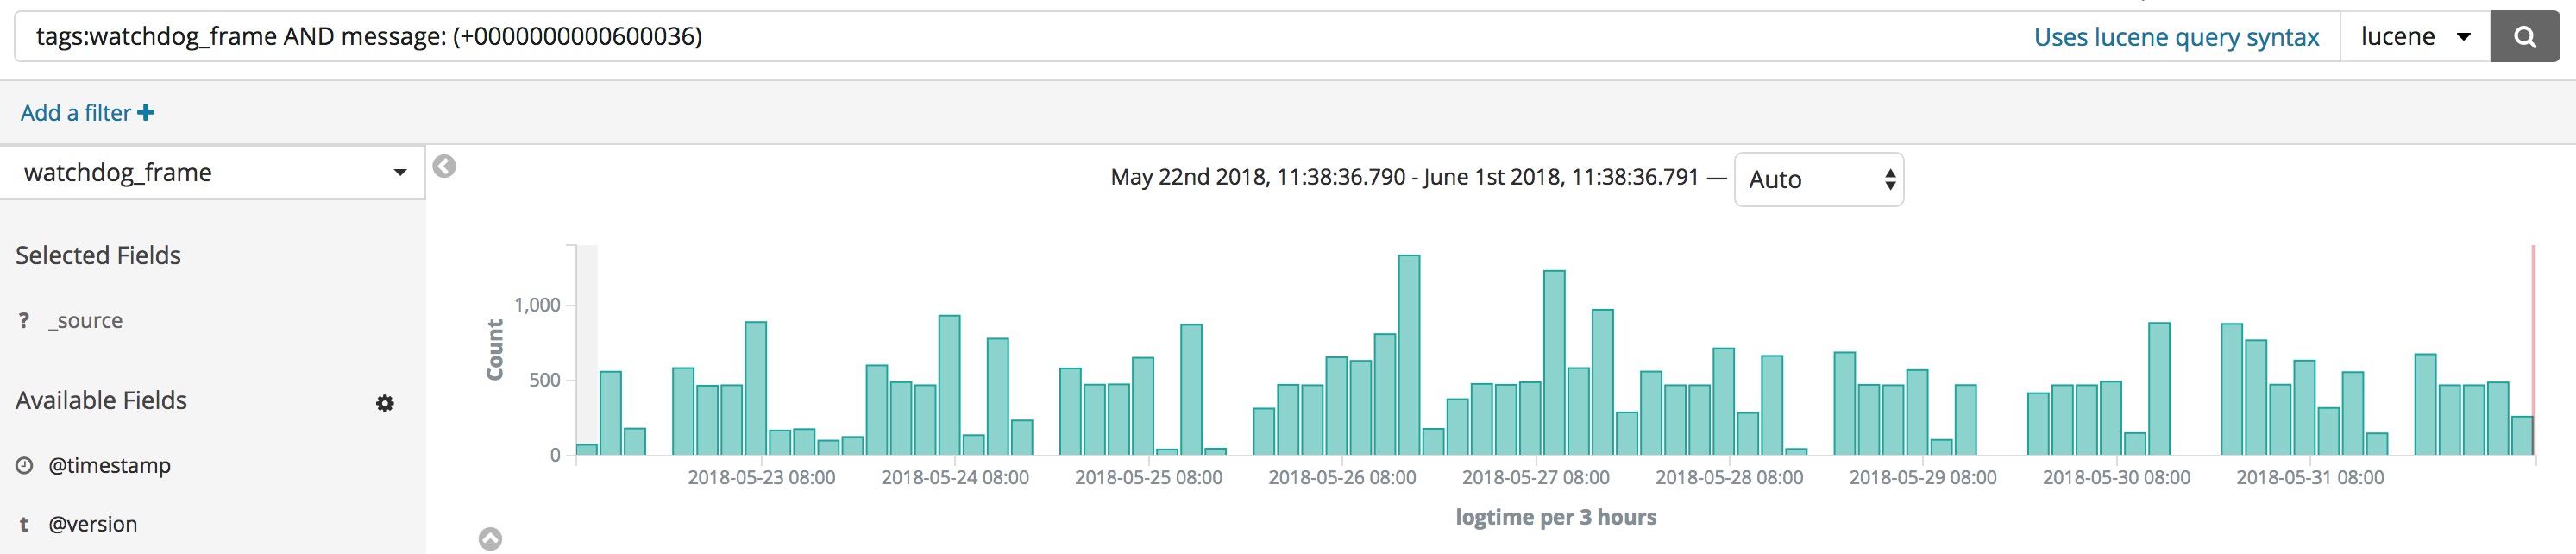
Detect Abnormal
1
2
3
4
UID: 0000000000600036
// detect abnormal
tags:watchdog_frame AND message: (+0000000000600036)Wikipedia uses Elasticsearch to provide full-text search with highlighted search snippets, and search-as-you-type and did-you-mean suggestions.
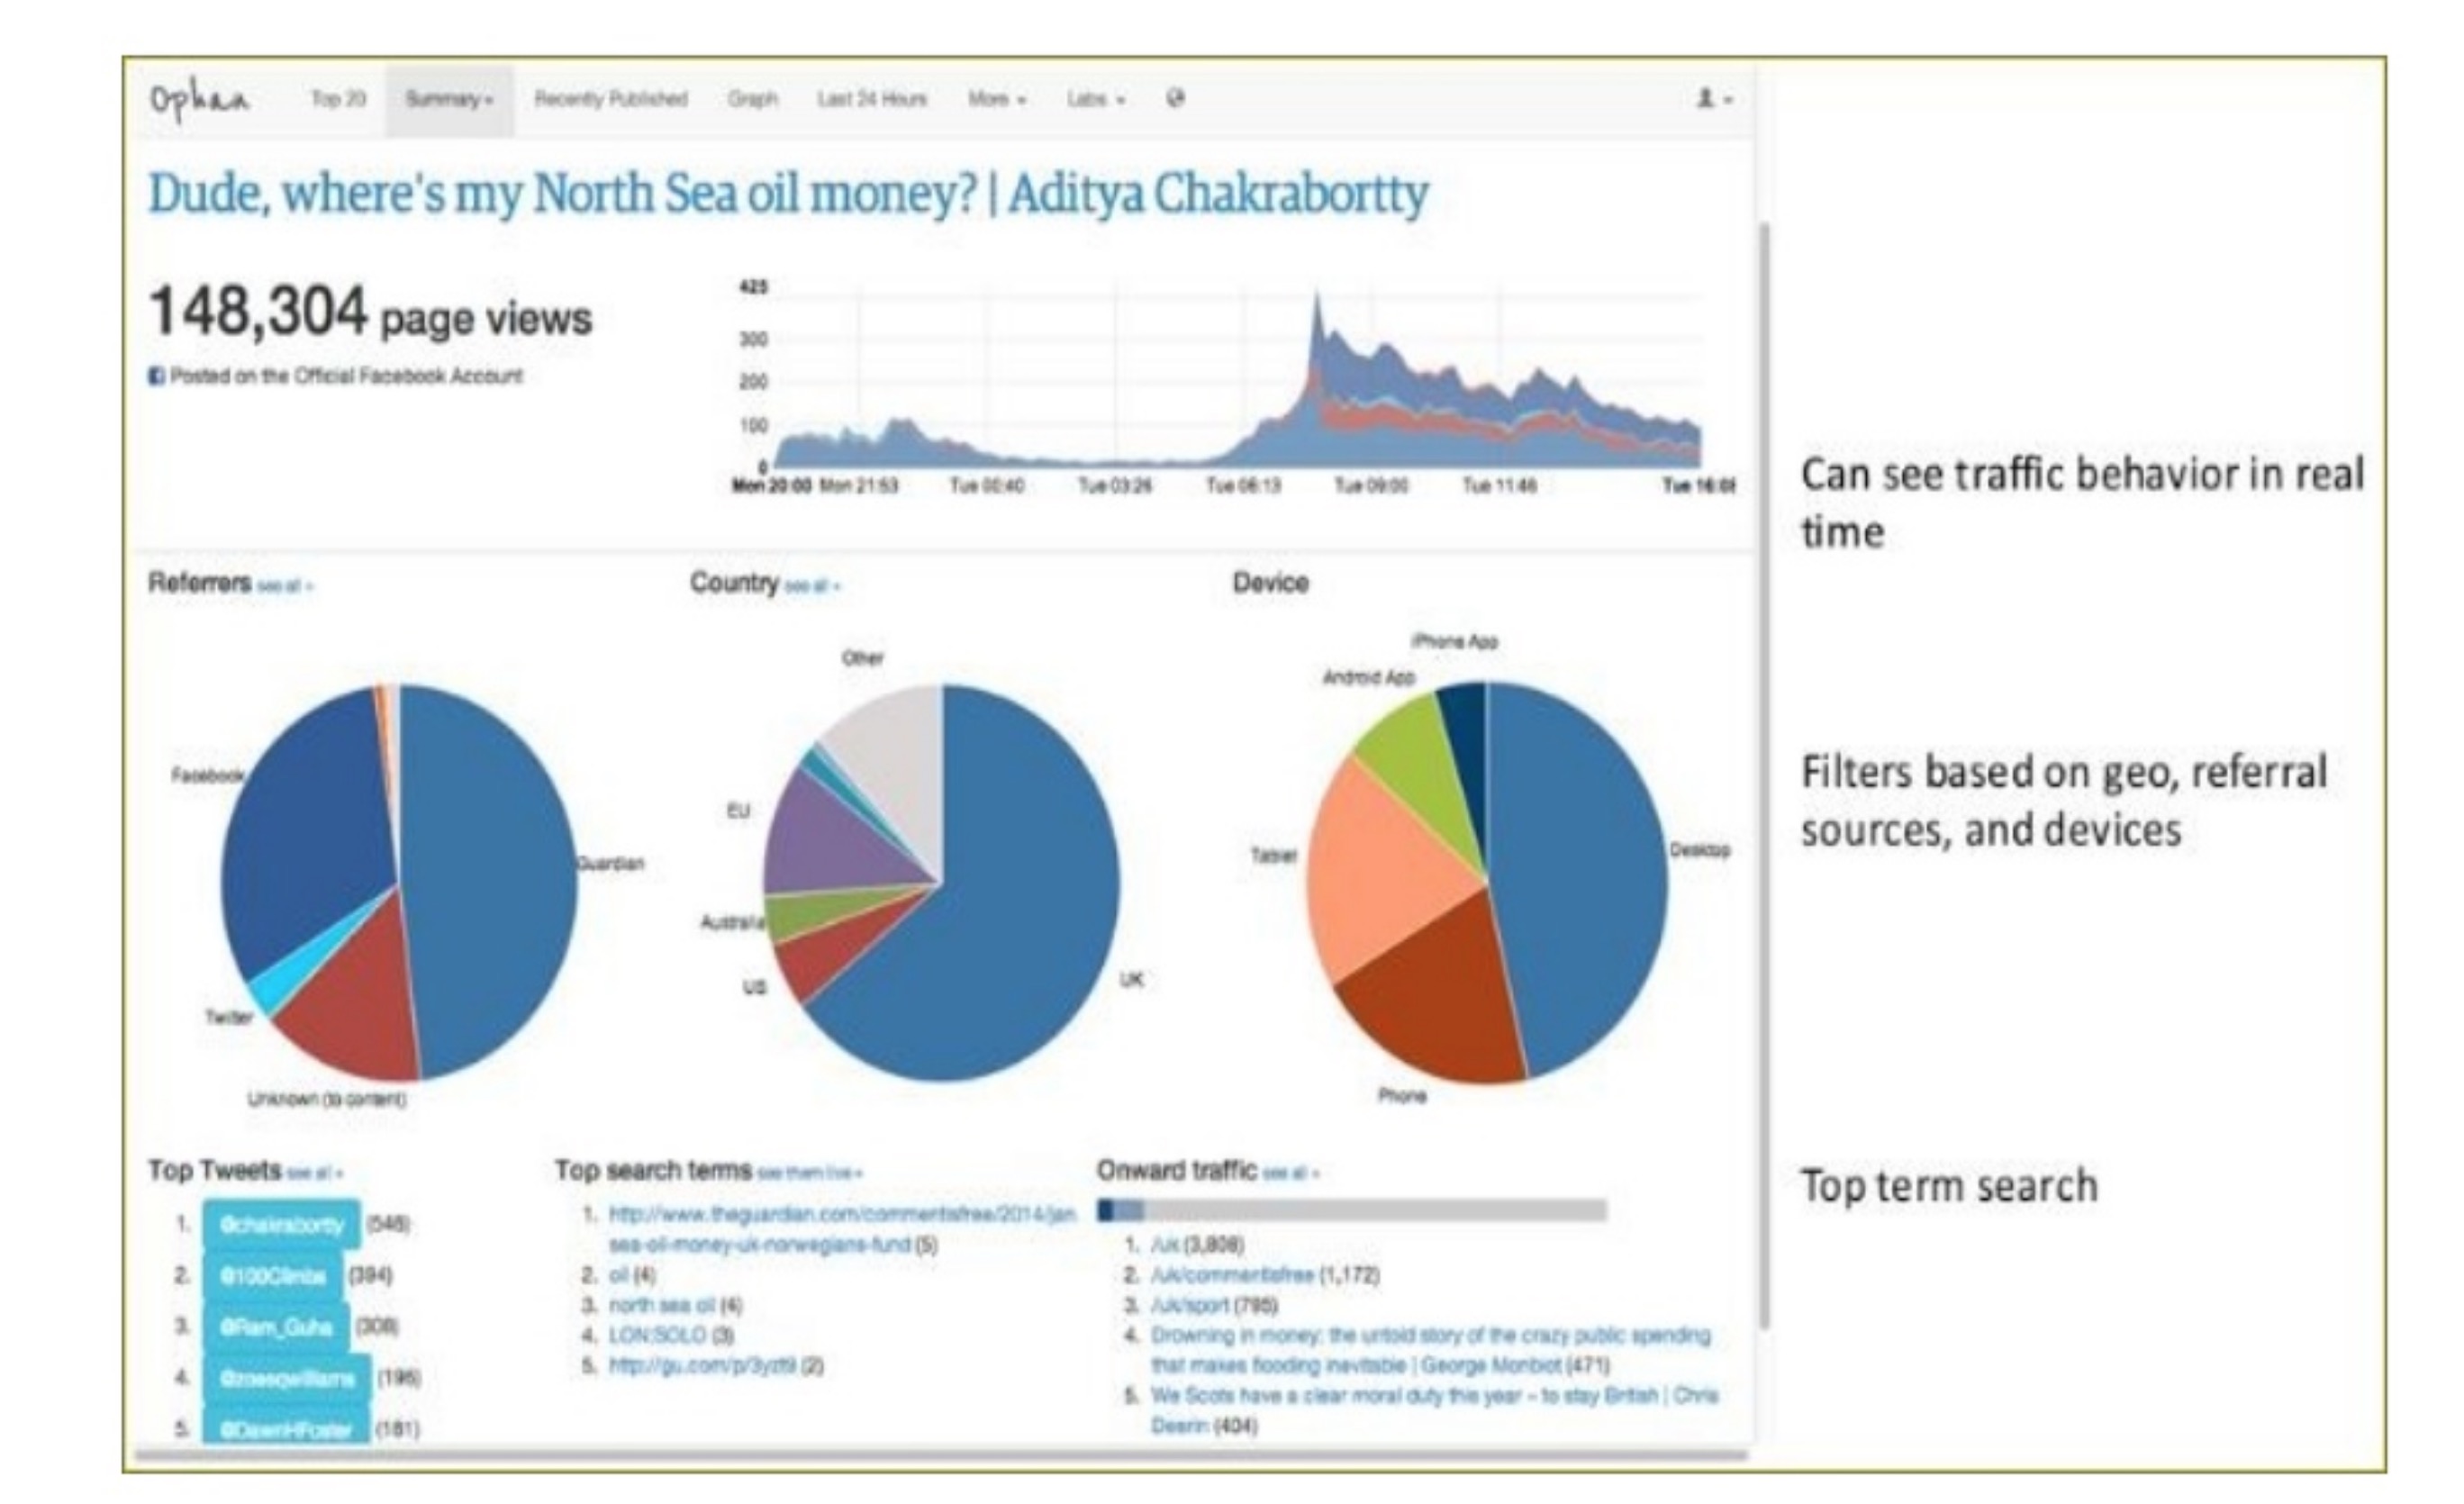
The Guardian uses Elasticsearch to combine visitor logs with social-network data to provide real-time feedback to its editors about the public’s response to new articles.
Stack Overflow combines full-text search with geolocation queries and uses more-like-this to find related questions and answers.
- Stack Overflow Uses Facets and Geo-Coding | Elastic
- How does Stack Overflow implement its search indexing? - Meta Stack Exchange
- A new search engine for Stack Exchange - Meta Stack Exchange
- Nick Craver - Stack Overflow: The Architecture - 2016 Edition
- StackOverflow Update: 560M Pageviews a Month, 25 Servers, and It’s All About Performance - High Scalability -
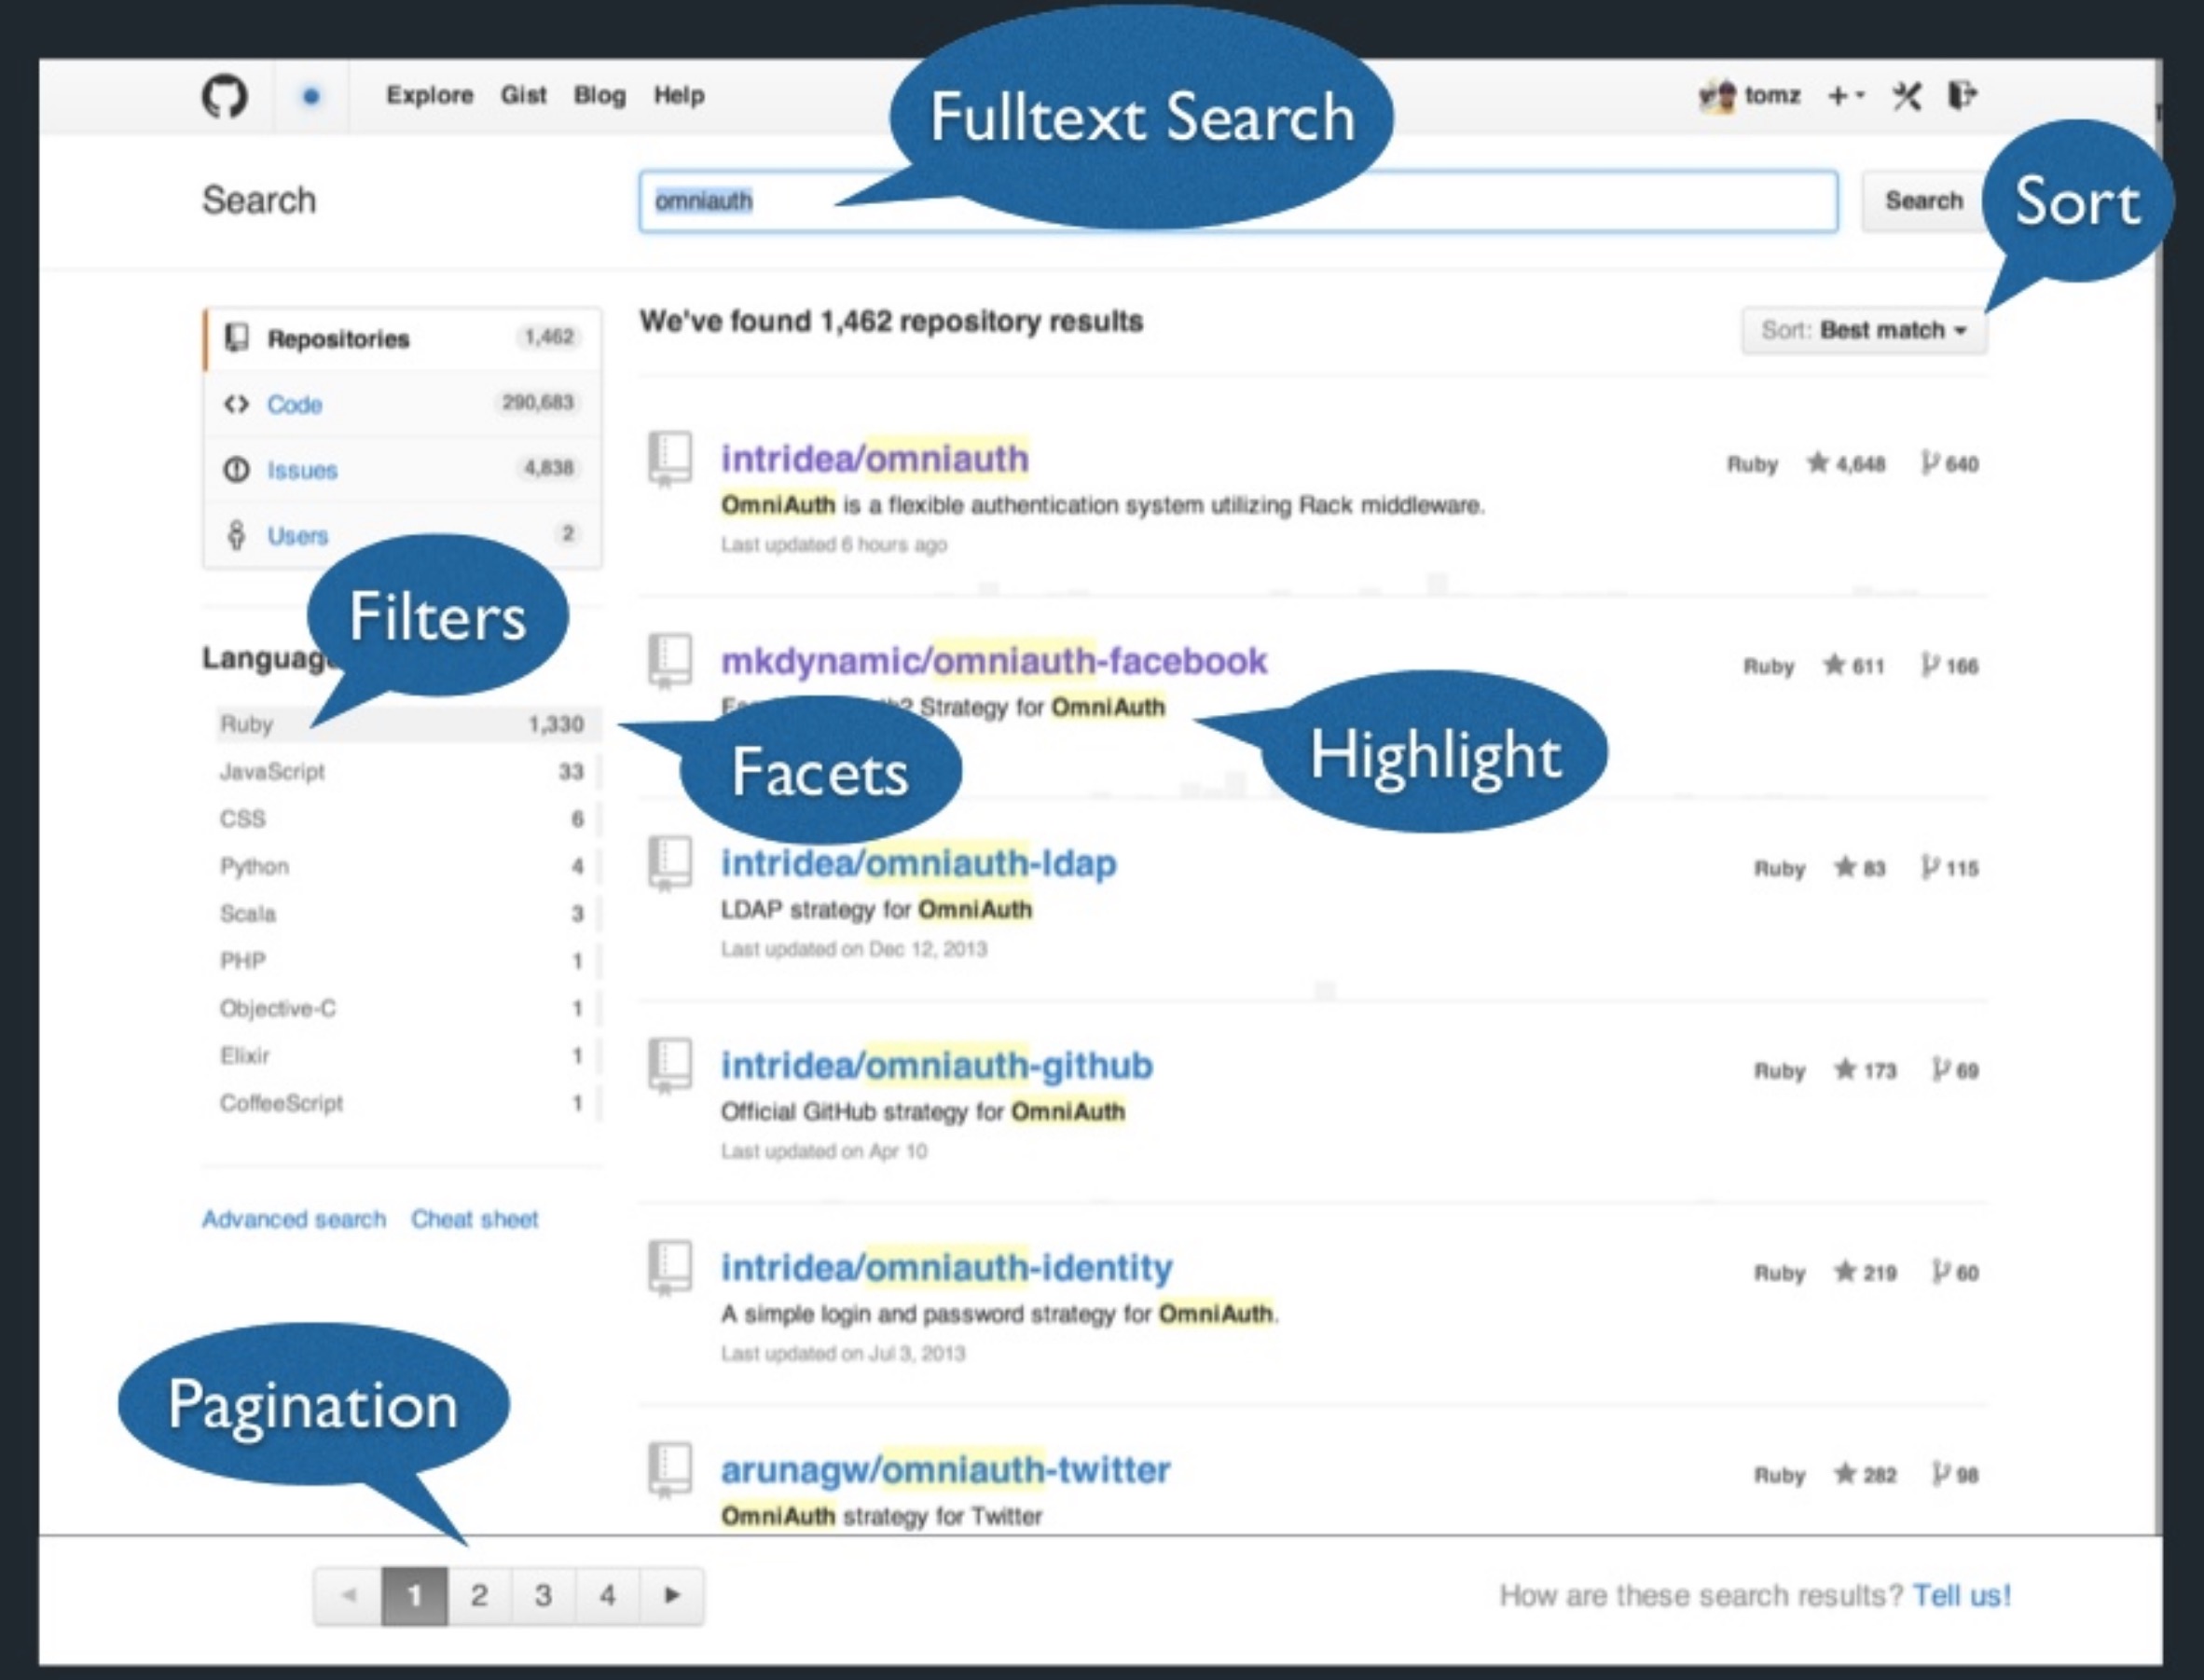
GitHub uses Elasticsearch to query 130 billion lines of code.
use Date Range
1 | // search log in the defined Range |
use tags and message to search frameLog
1 | //search tags is watchdog_frame and message contains 82973 (orderId) |
search ActionLog
1 | logType: WARN |
more
1 | // use regex |
Direct access to the Elasticsearch API
1 | // indices setting |
How to view
Why Elastic
Distributed & Scalable
Resilient; designed for scale-out
High availability; multitenancy
Structured & unstructured data
Developer Friendly
Schemaless
Native JSON
Client libraries
Apache Lucene
Search & Analytics
Near Real-time
Full-text search
Aggregations
Geospatial
Multilingua
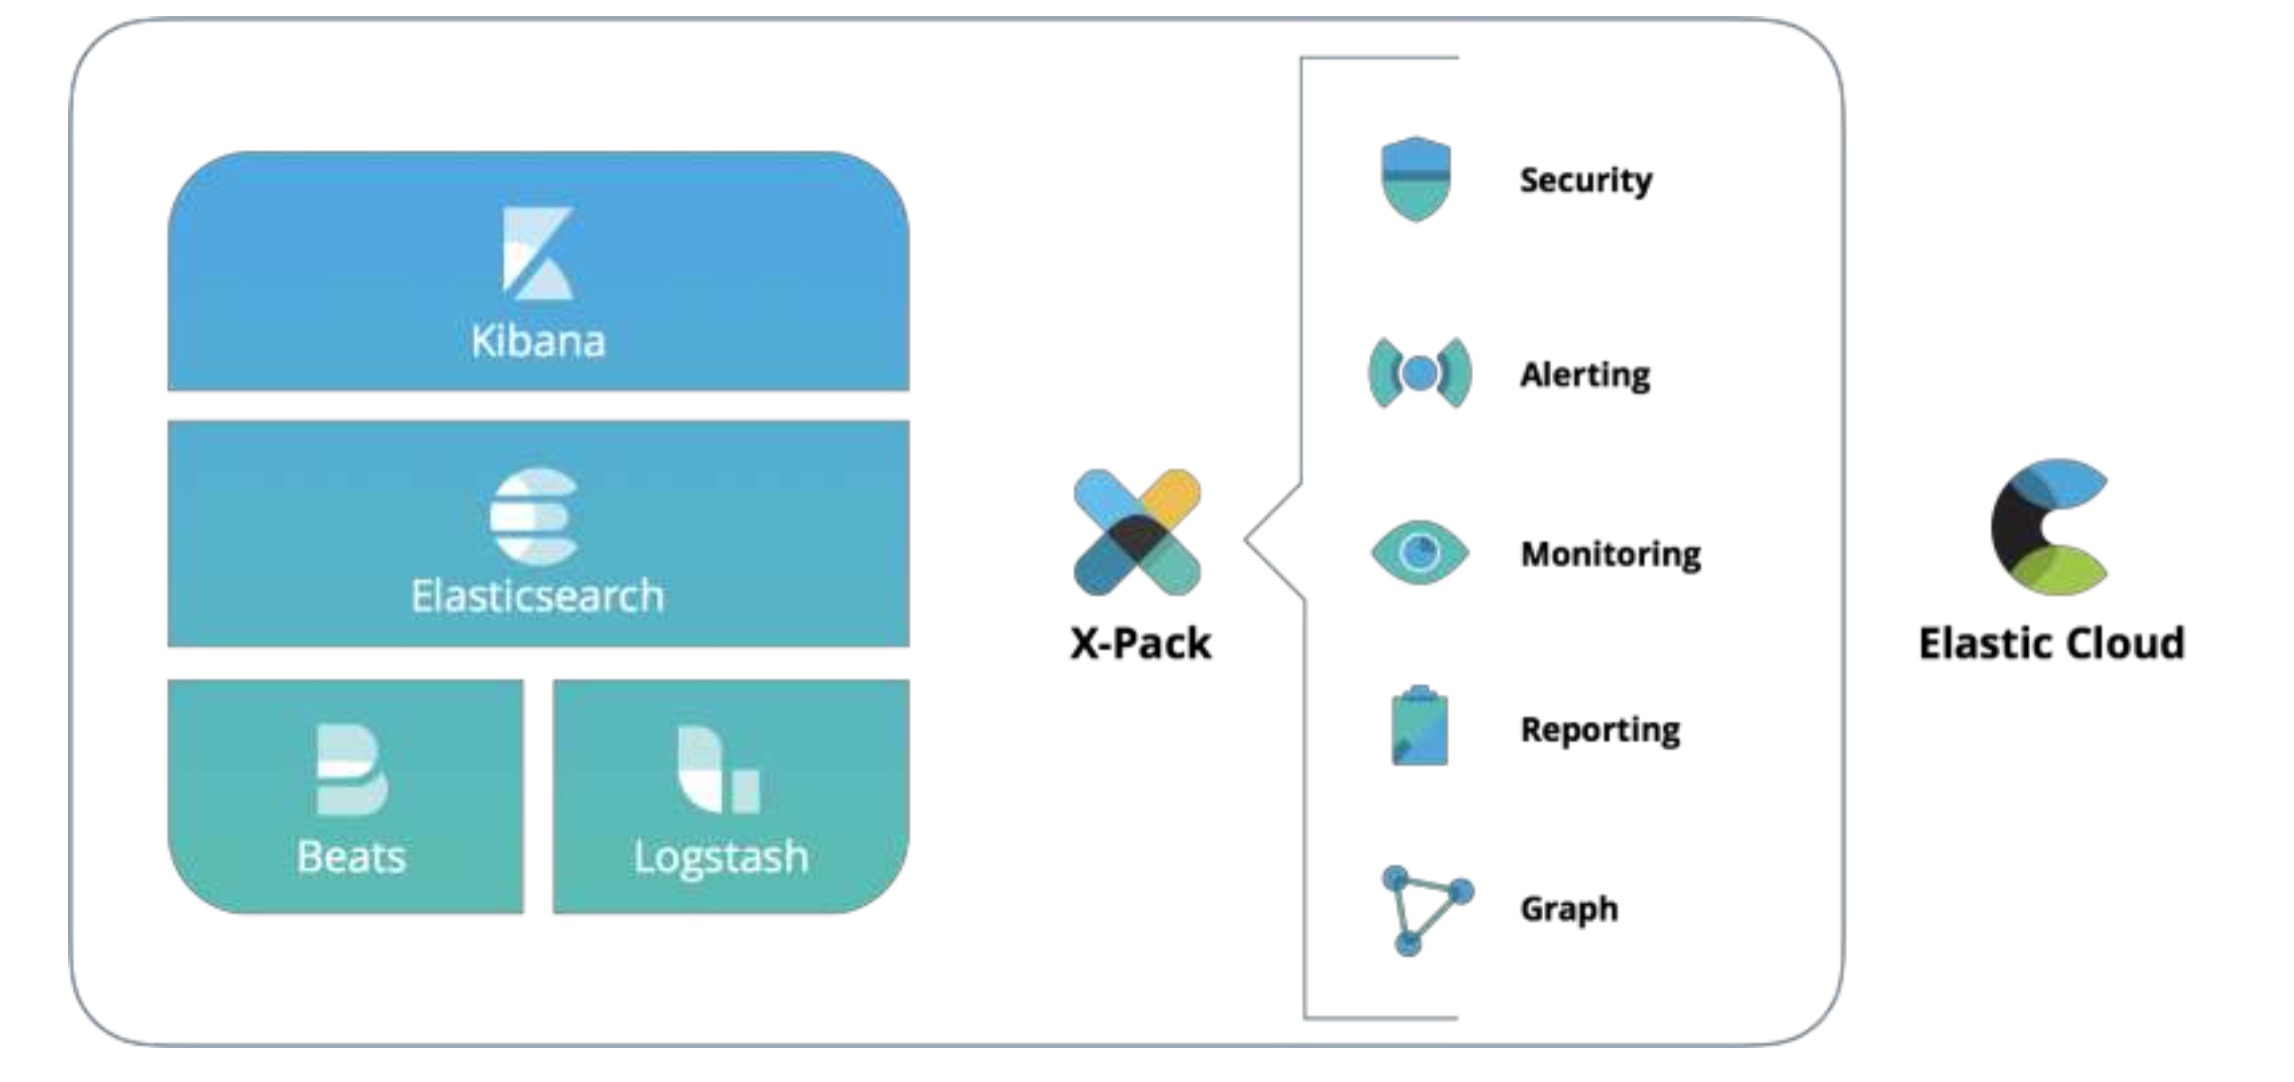
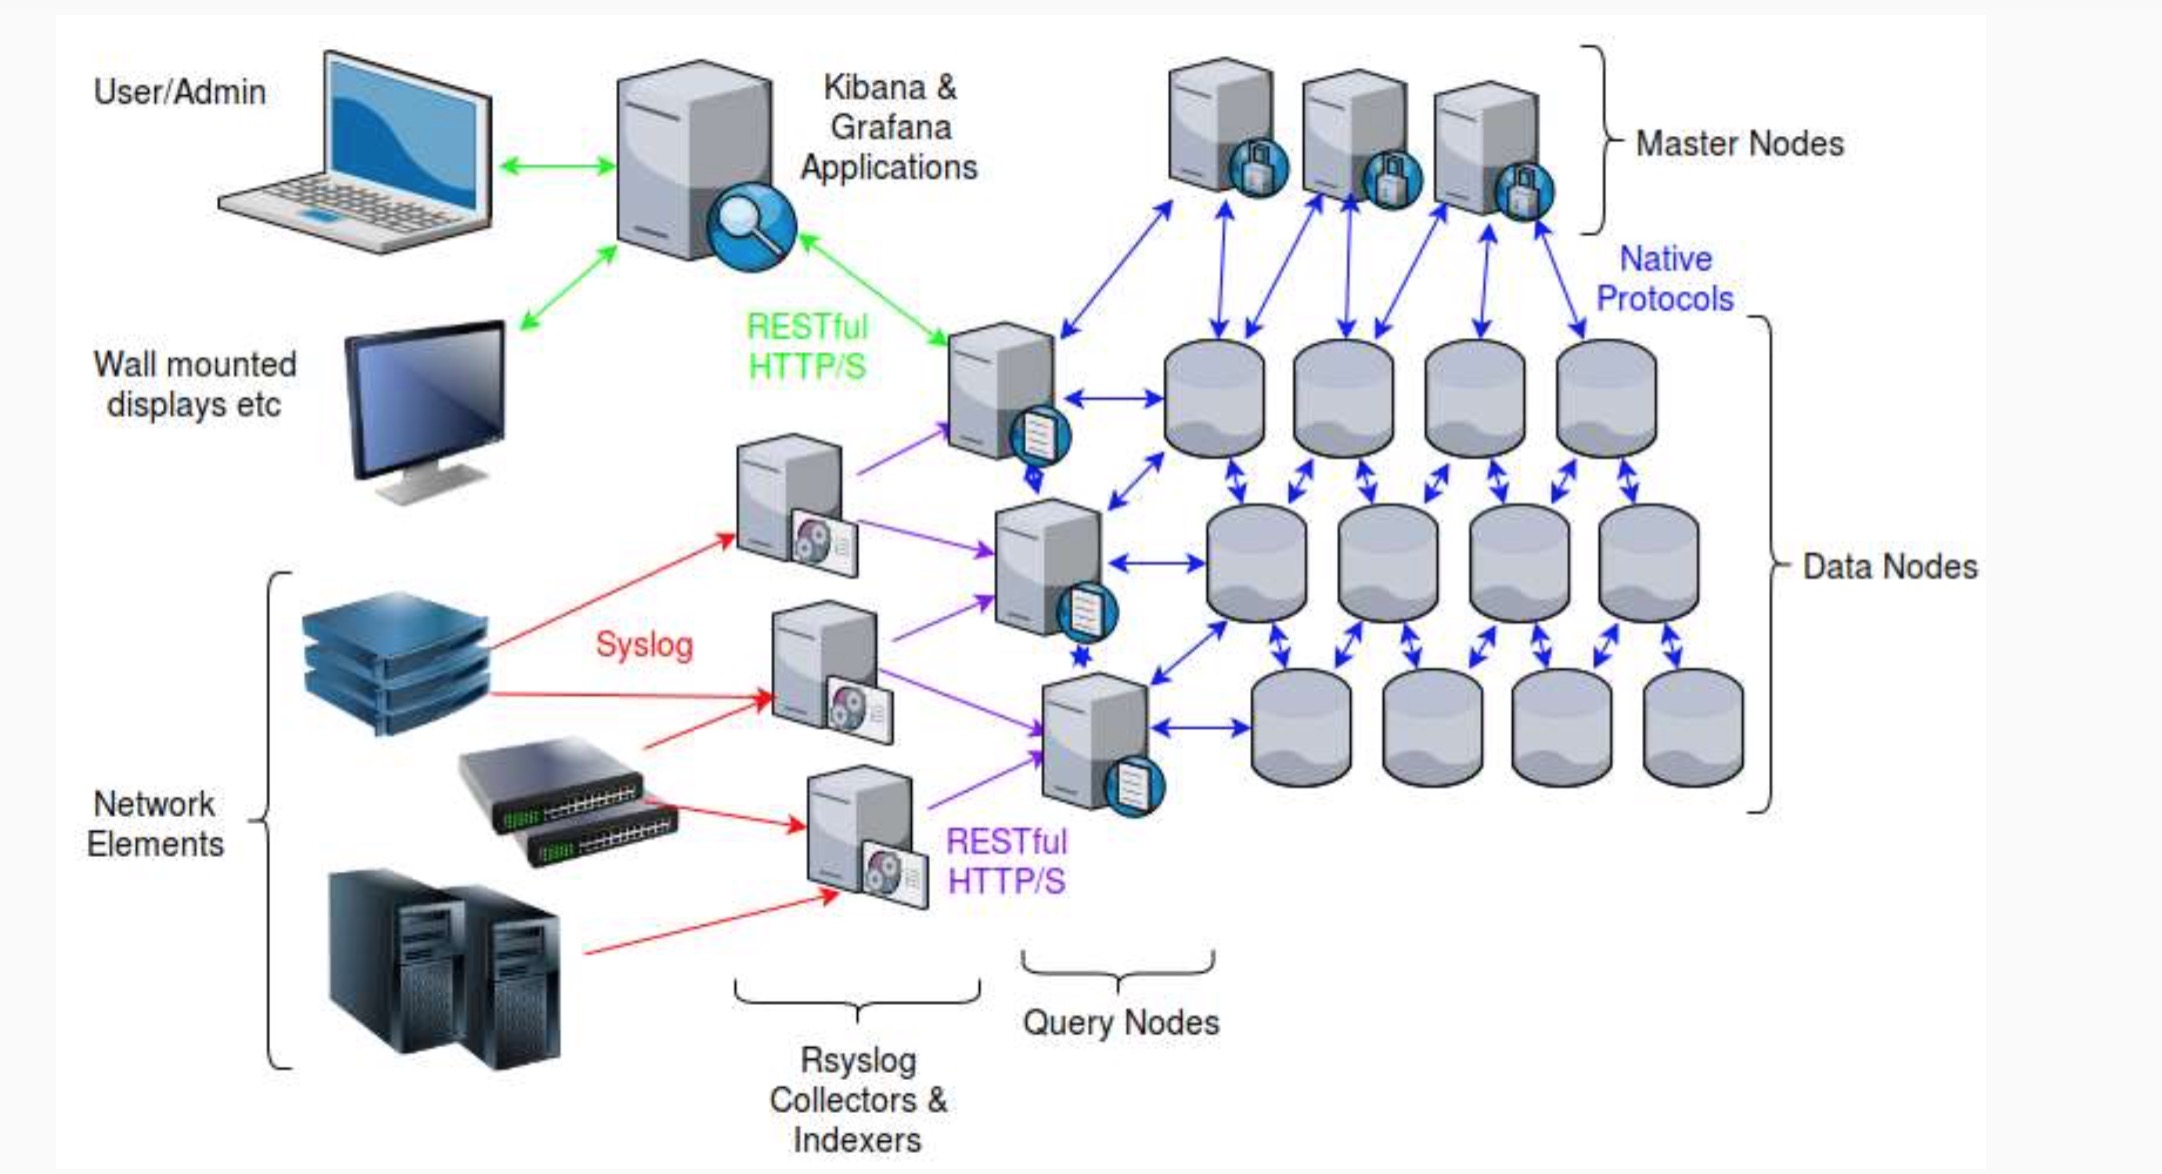
The Elastic Stack
Architecture
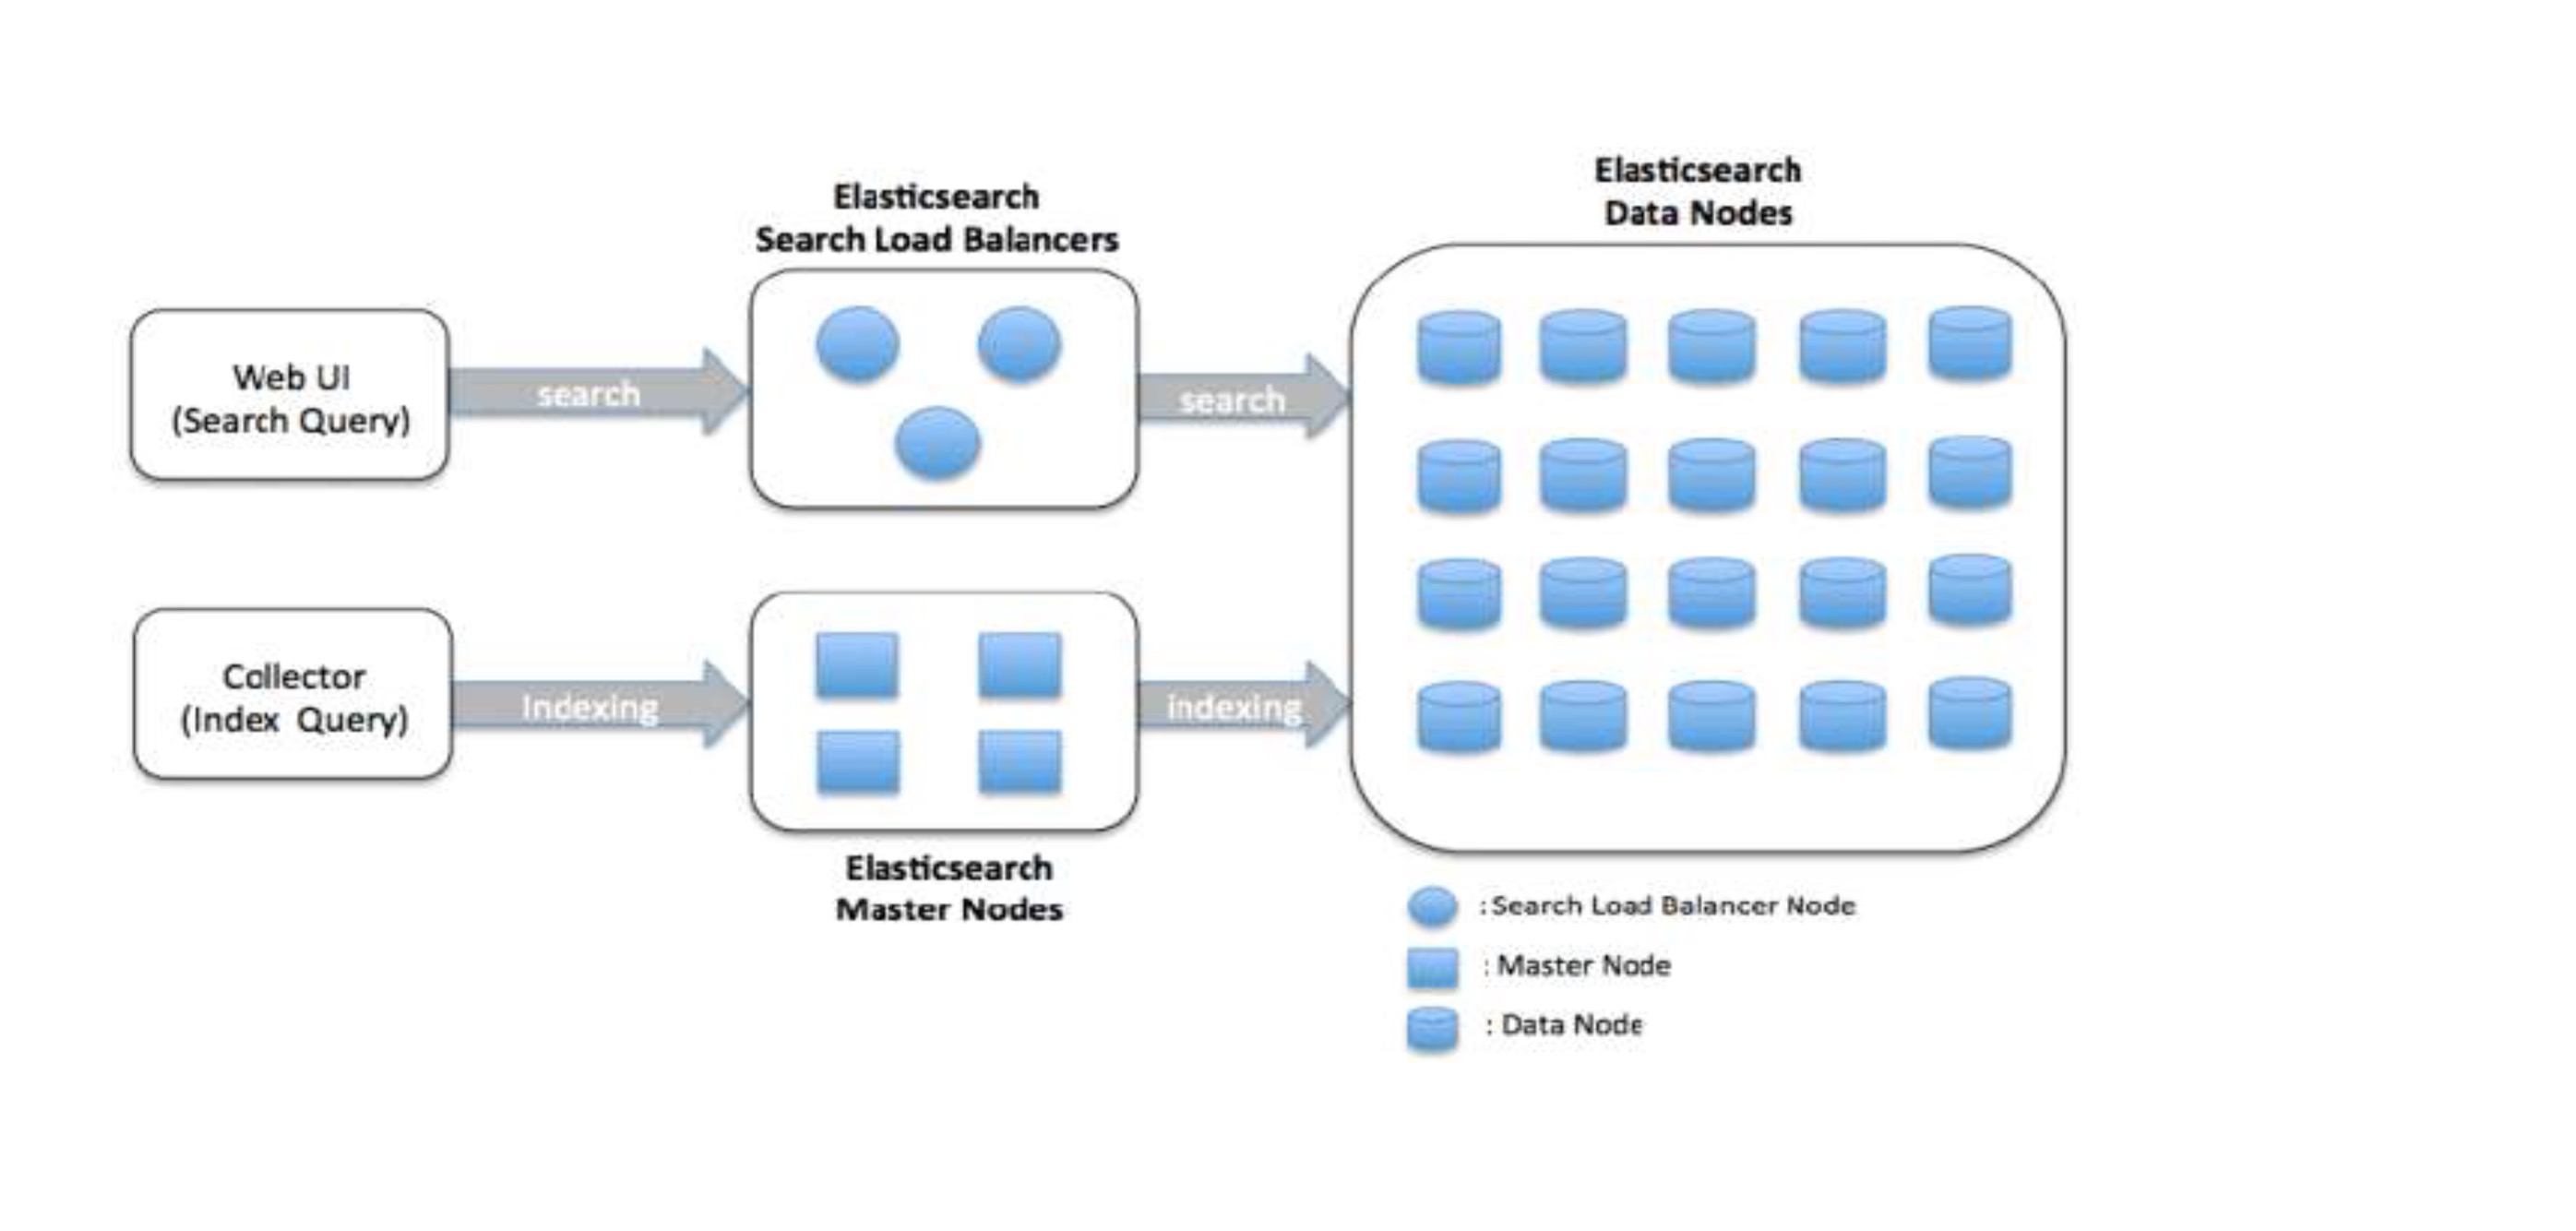
Elasticsearch Cluster deploy
TERMINOLOGY
| MySQL | Elastic Search |
|---|---|
| Database | Index |
| Table | Type |
| Row | Document |
| Column | Field |
| Schema | Mapping |
| Index | Everything is indexed |
| Partition | Shard |
| SQL | Query DSL |
| SELECT field, COUNT(*)FROM table GROUP BY field | Facet(Aggregations) |
| SELECT * FROM table … | GET http://… |
| UPDATE table SET … | PUT http://… |
How to understand
Basic Concepts
- Cluster:
A cluster consists of one or more nodes which share the same cluster name. Each cluster has a single master node which is chosen automatically by the cluster and which can be replaced if the current master node fails
Node:
A node is a running instance of ElasticSearch which belongs to a cluster. Multiple nodes can be started on a single server for testing purposes, but usually you should have one node per server. At startup, a node will use unicast for multicast, if specified) to discover an existing cluster with the same cluster name and will try to join that cluster.Index:
An index is like a database in a relational database. It has a mapping which defines multiple types. An index is a logical namespace which maps to one or more primary shards and can have zero or more replica shards.Type:
A type is like a table in a relational database. Each type has a list of fields that can be specified for documents of that type. The mapping defines how each field in the document is analyzed.Document:
A document is a SON document which is stored in ElasticSearch. it is like a row in a table in a relational database. Each
document is stored in an index and has a type and an id a document is a JSON object(also known in other languages as a hash/hashmap/associative array) which contains zero or more fields, or key-value pairs. The original JSON document that is indexed will be stored in the_sourcefield, which is returned by default when getting or searching for a document.Field:
A document contains a list of fields, or key-value pairs. The value can be a simple(scalar) value (eg a string, integer, date),or a nested structure like an array or an object. A field is similar to a column in a table in a relational database. The mapping for each field has a field type (not to be confused with document type)which indicates the type of data that can be stored in that field, eg integer, string, object. The mapping also allows you to define (amongst other things) how the value for a field should be analyzed.Mapping:
A mapping is like a ‘schema definition’ in a relational database. Each index has a mapping, which defines each type within the index, plus a number of index-wide settings A mapping can either be defined explicitly, or it will be generated automatically when a document is indexed.Facets(Aggregations):
Faceted search refers to a way to explore large amounts of data by displaying summaries about various partitions of the data and later allowing to narrow the navigation to a specific partition.
In Elasticsearch,facetsare also the name of a feature that allowed to compute these summaries.facetshave been replaced by aggregations in Elasticsearch 1.0, which are a superset of facets.Shard:
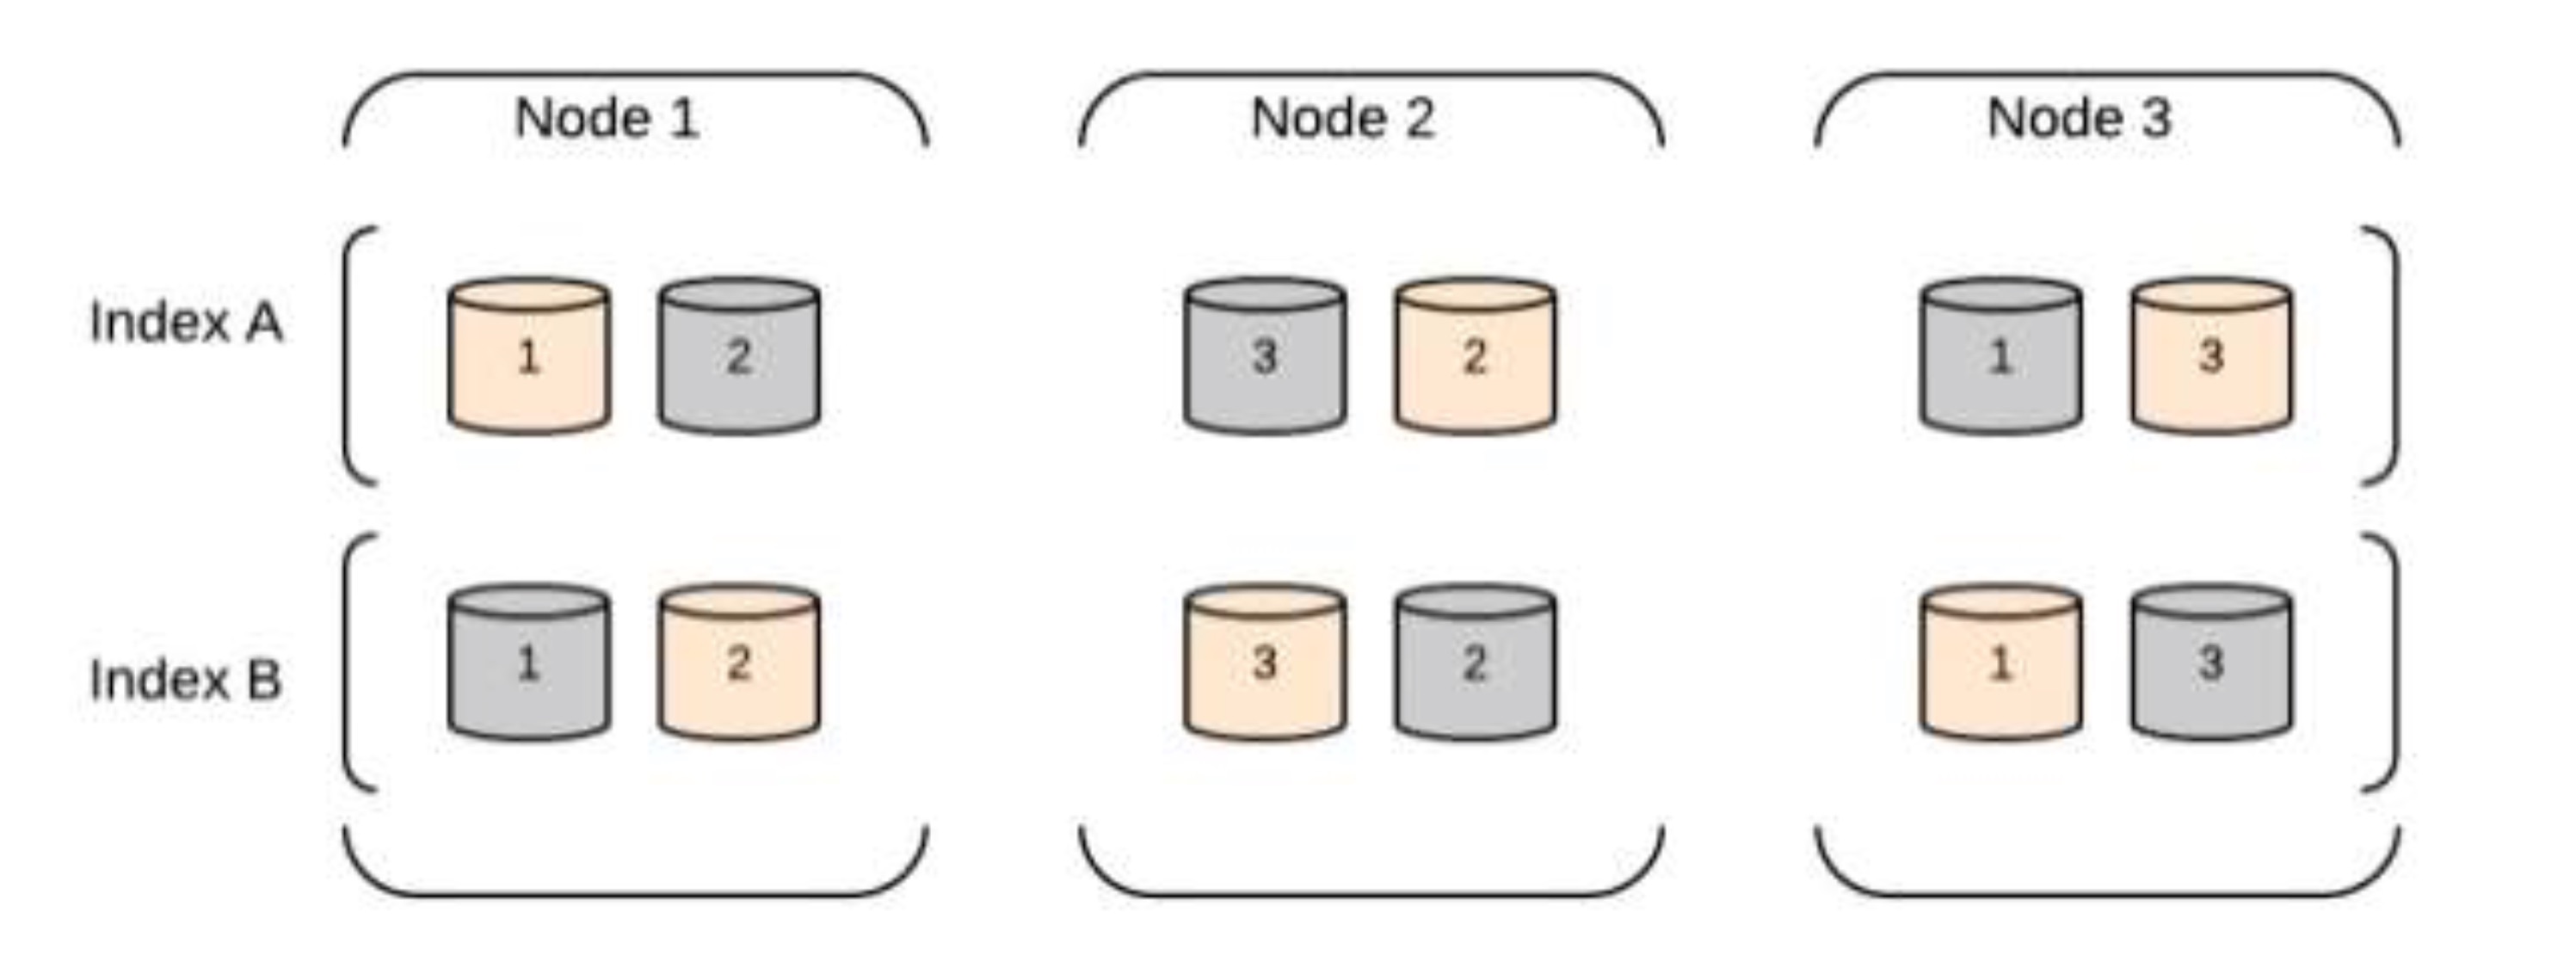
A shard is a single Lucene instance. It is a low-level “worker” unit which is managed automatically by ElasticSearch. An index is a logical namespace which points to primary and replica shards.
ElasticSearch distributes shards amongst all nodes in the cluster, and can move shards automatically from one node to another in the case of node failure, or the addition of new nodesPrimary Shard:
Each document is stored in a single primary shard. When a document is send for indexing, it is indexed first on the primary shard, then on all replicas of the primary shard. By default, an index has 5 primary shards. You can specify fewer or more primary shards to scale the number of documents that your index can handle.Replica Shard:
Each primary shard can have zero or more replicas. A replica is a copy of the primary shard, and has two purposes:
a. increase failover: a replica shard can be promoted to a primary shard if the primary fails.
b. increase performance: get and search requests can be handled by primary or replica shards.- Identified by “_index/_type/_id”
Configuration
- cluster.name:
Cluster name identifies duster for auto-discovery If production environment has multiple clusters on the same network, duster name must be unique. - node.name:
Node names are generated dynamically on startup. But user can specify a name to node manual. - node.master&node.data:
Every node can be configured to allow or deny being eligible as the master, and to allow or deny to store the data, Master allow this node to be eligible as a master node(enabled by default)and Data allow this node to store data (enabled by default)
Following are the settings to design advanced duster topologies.
If a node to never become a master node, only to hold data. This will be the” workhorse”of the duster.
node master: false, node data: trueIf a node to only serve as a master and not to store data and to have free resources. This will be the “coordinator” of the cluster.
node master: true, node data: falseIf a node to be neither master nor data node, but to act as a”search load balancer”(fetching data from nodes, aggregating, etc)
node master: false, node data: false
Index:
A number of options(such as shard/replica options, mapping or analyzer definitions, translog settings, .) can be set for indices globally, in this file.
Note, that it makes more sense to configure index settings specifically for a certain index, either when creating it or by using the index templates API..
example.index.number_of_shards: 5, index.number_of_replicas: 1Discovery:
ElasticSearch supports different types of discovery, which makes multiple ElasticSearch instances talk to each other.
The default type of discovery is multicast. Unicast discovery allows to explicitly control which nodes will be used to discover the duster. it can be used when multicast is not present, or to restrict the duster communication-wise.
Index Versus Index Versus Inverted Index

You may already have noticed that the word index is overloaded with several meanings in the context of Elasticsearch. A little clarification is necessary:
Index (noun)
As explained previously, an index is like a database in a traditional relational database. It is the place to store related documents. The plural of index is indices or indexes.
Index (verb)
To index a document is to store a document in an index (noun) so that it can be retrieved and queried. It is much like the
INSERTkeyword in SQL except that, if the document already exists, the new document would replace the old.Inverted index
Relational databases add an index, such as a B-tree index, to specific columns in order to improve the speed of data retrieval. Elasticsearch and Lucene use a structure called an inverted index for exactly the same purpose. By default, every field in a document is indexed (has an inverted index) and thus is searchable. A field without an inverted index is not searchable. We discuss inverted indexes in more detail in Inverted Index.
Cluster Architecture
- Partitioning your documents into different containers or shards, which can bestored on a single node or on multiple nodes.
- Balancing these shards across the nodes in your cluster to spread the indexing andsearch load.
- Duplicating each shard to provide redundant copies of your data, to prevent dataloss in case of hardware failure.
- Routing requests from any node in the cluster to the nodes that hold the data you’reinterested in.
- Seamlessly integrating new nodes as your cluster grows or redistributing shards torecover from node loss.
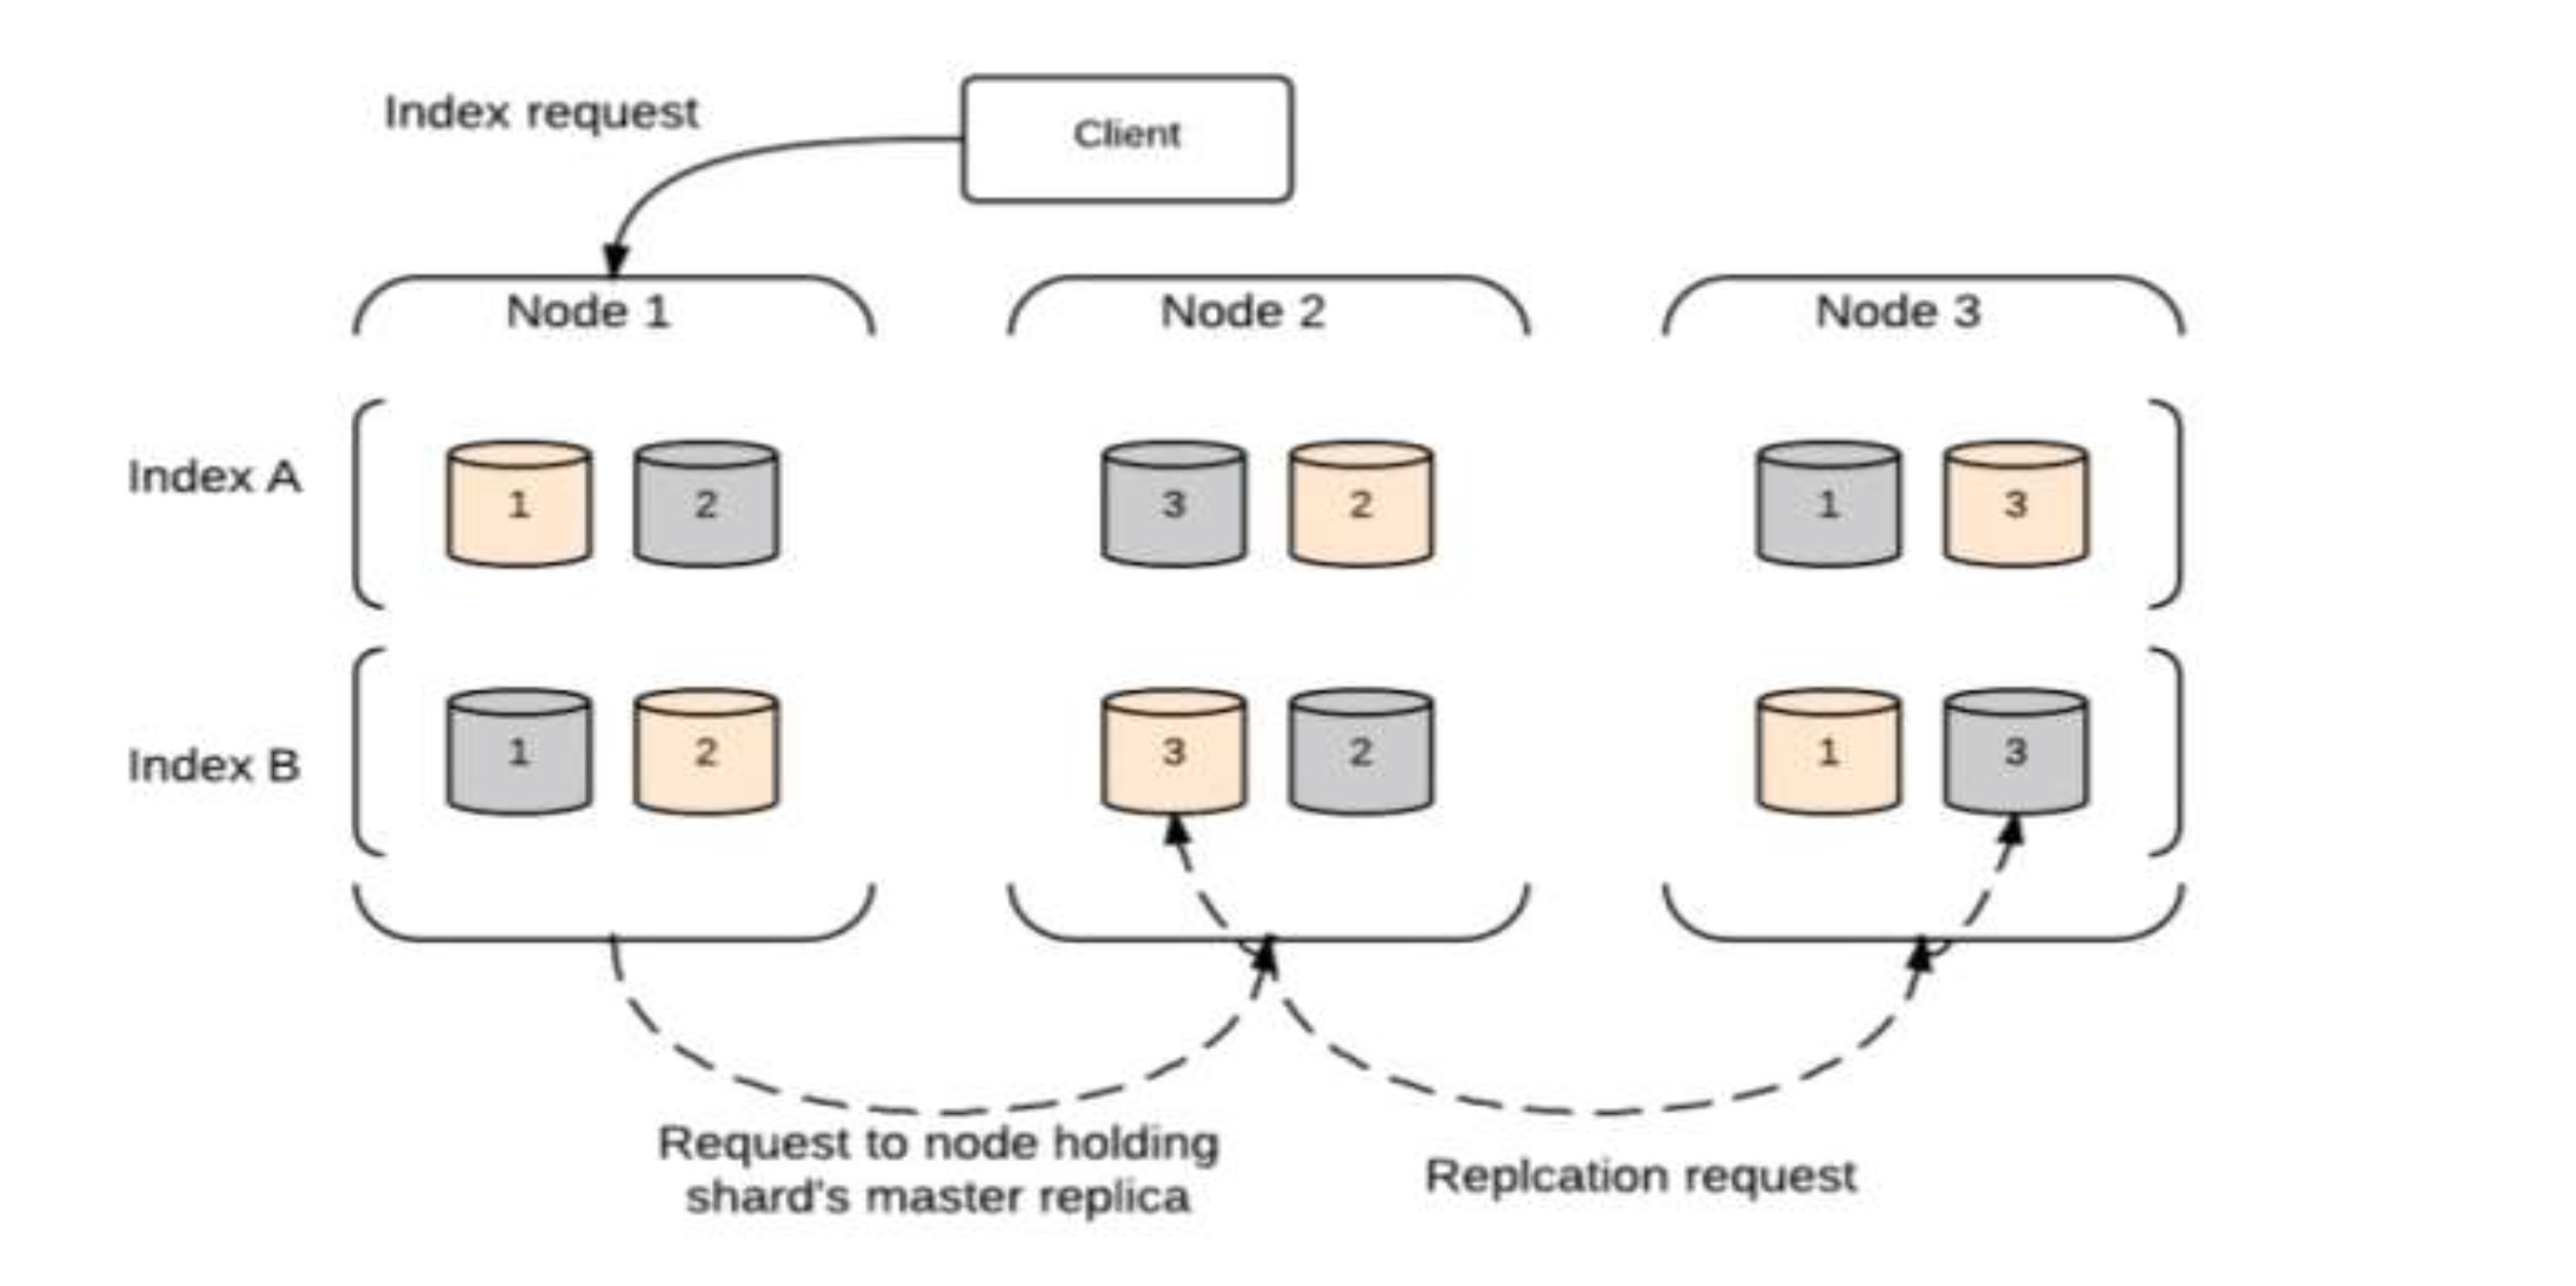
Index Request
1
2
3
4
5
6
7
8
9
10Request :
PUT test/cities/1 {
"rank": 3,
"city": "Hyderabad",
"state": "Telangana", "population2014": 7750000, "land_area": 625, "location":
{
"lat": 17.37,
"lon": 78.48 },
"abbreviation": "Hyd" }
Response : { "_index": "test", "_type": "cities", "_id": "1", "_version": 1, "created": true }
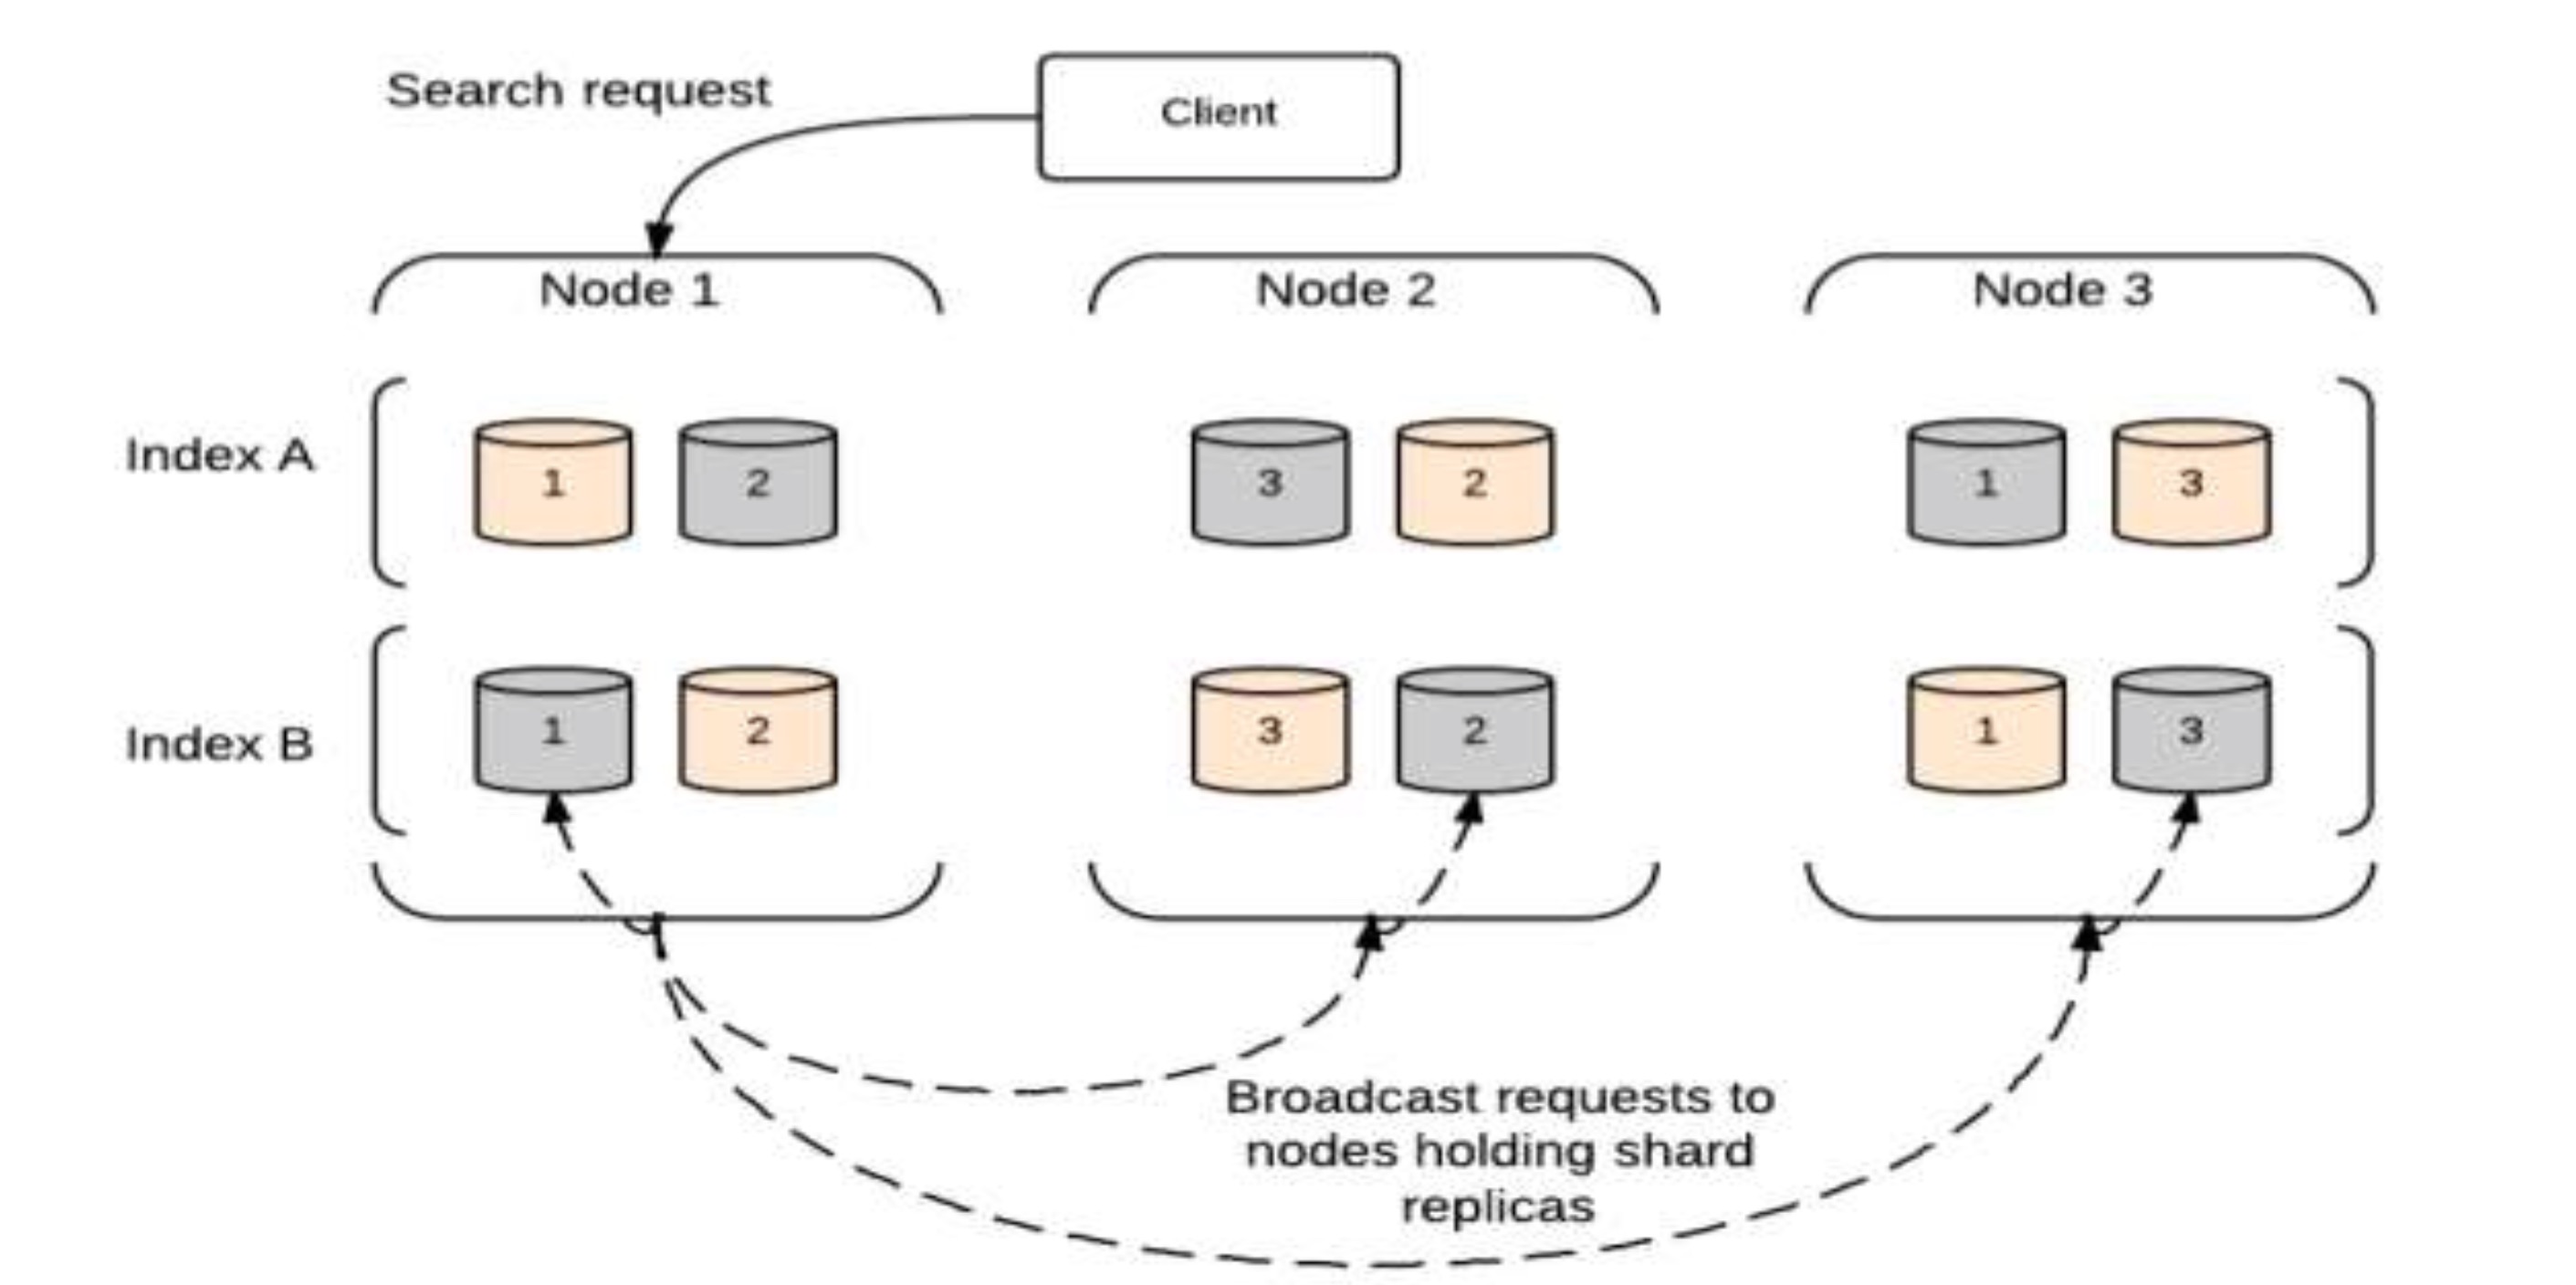
Search Request
1
2
3
4
5
6
7
8
9
10
11Request :
GET test/cities/1?pretty
Response : {
"_index": "test", "_type": "cities", "_id": "1", "_version": 1, "found": true, "_source": {
"rank": 3,
"city": "Hyderabad",
"state": "Telangana", "population2014": 7750000, "land_area": 625, "location": {
"lat": 17.37,
"lon": 78.48 },
"abbreviation": "Hyd" }
}
Updating a document
1 | Request : |
Searching
Search across all indexes and all types
http://localhost:9200/_searchSearch across all types in the test index.
http://localhost:9200/test/_searchSearch explicitly for documents of type cities within the test index.
http://localhost:9200/test/cities/_search